Leading on from last week’s interviews, I took a closer look at understanding my users.
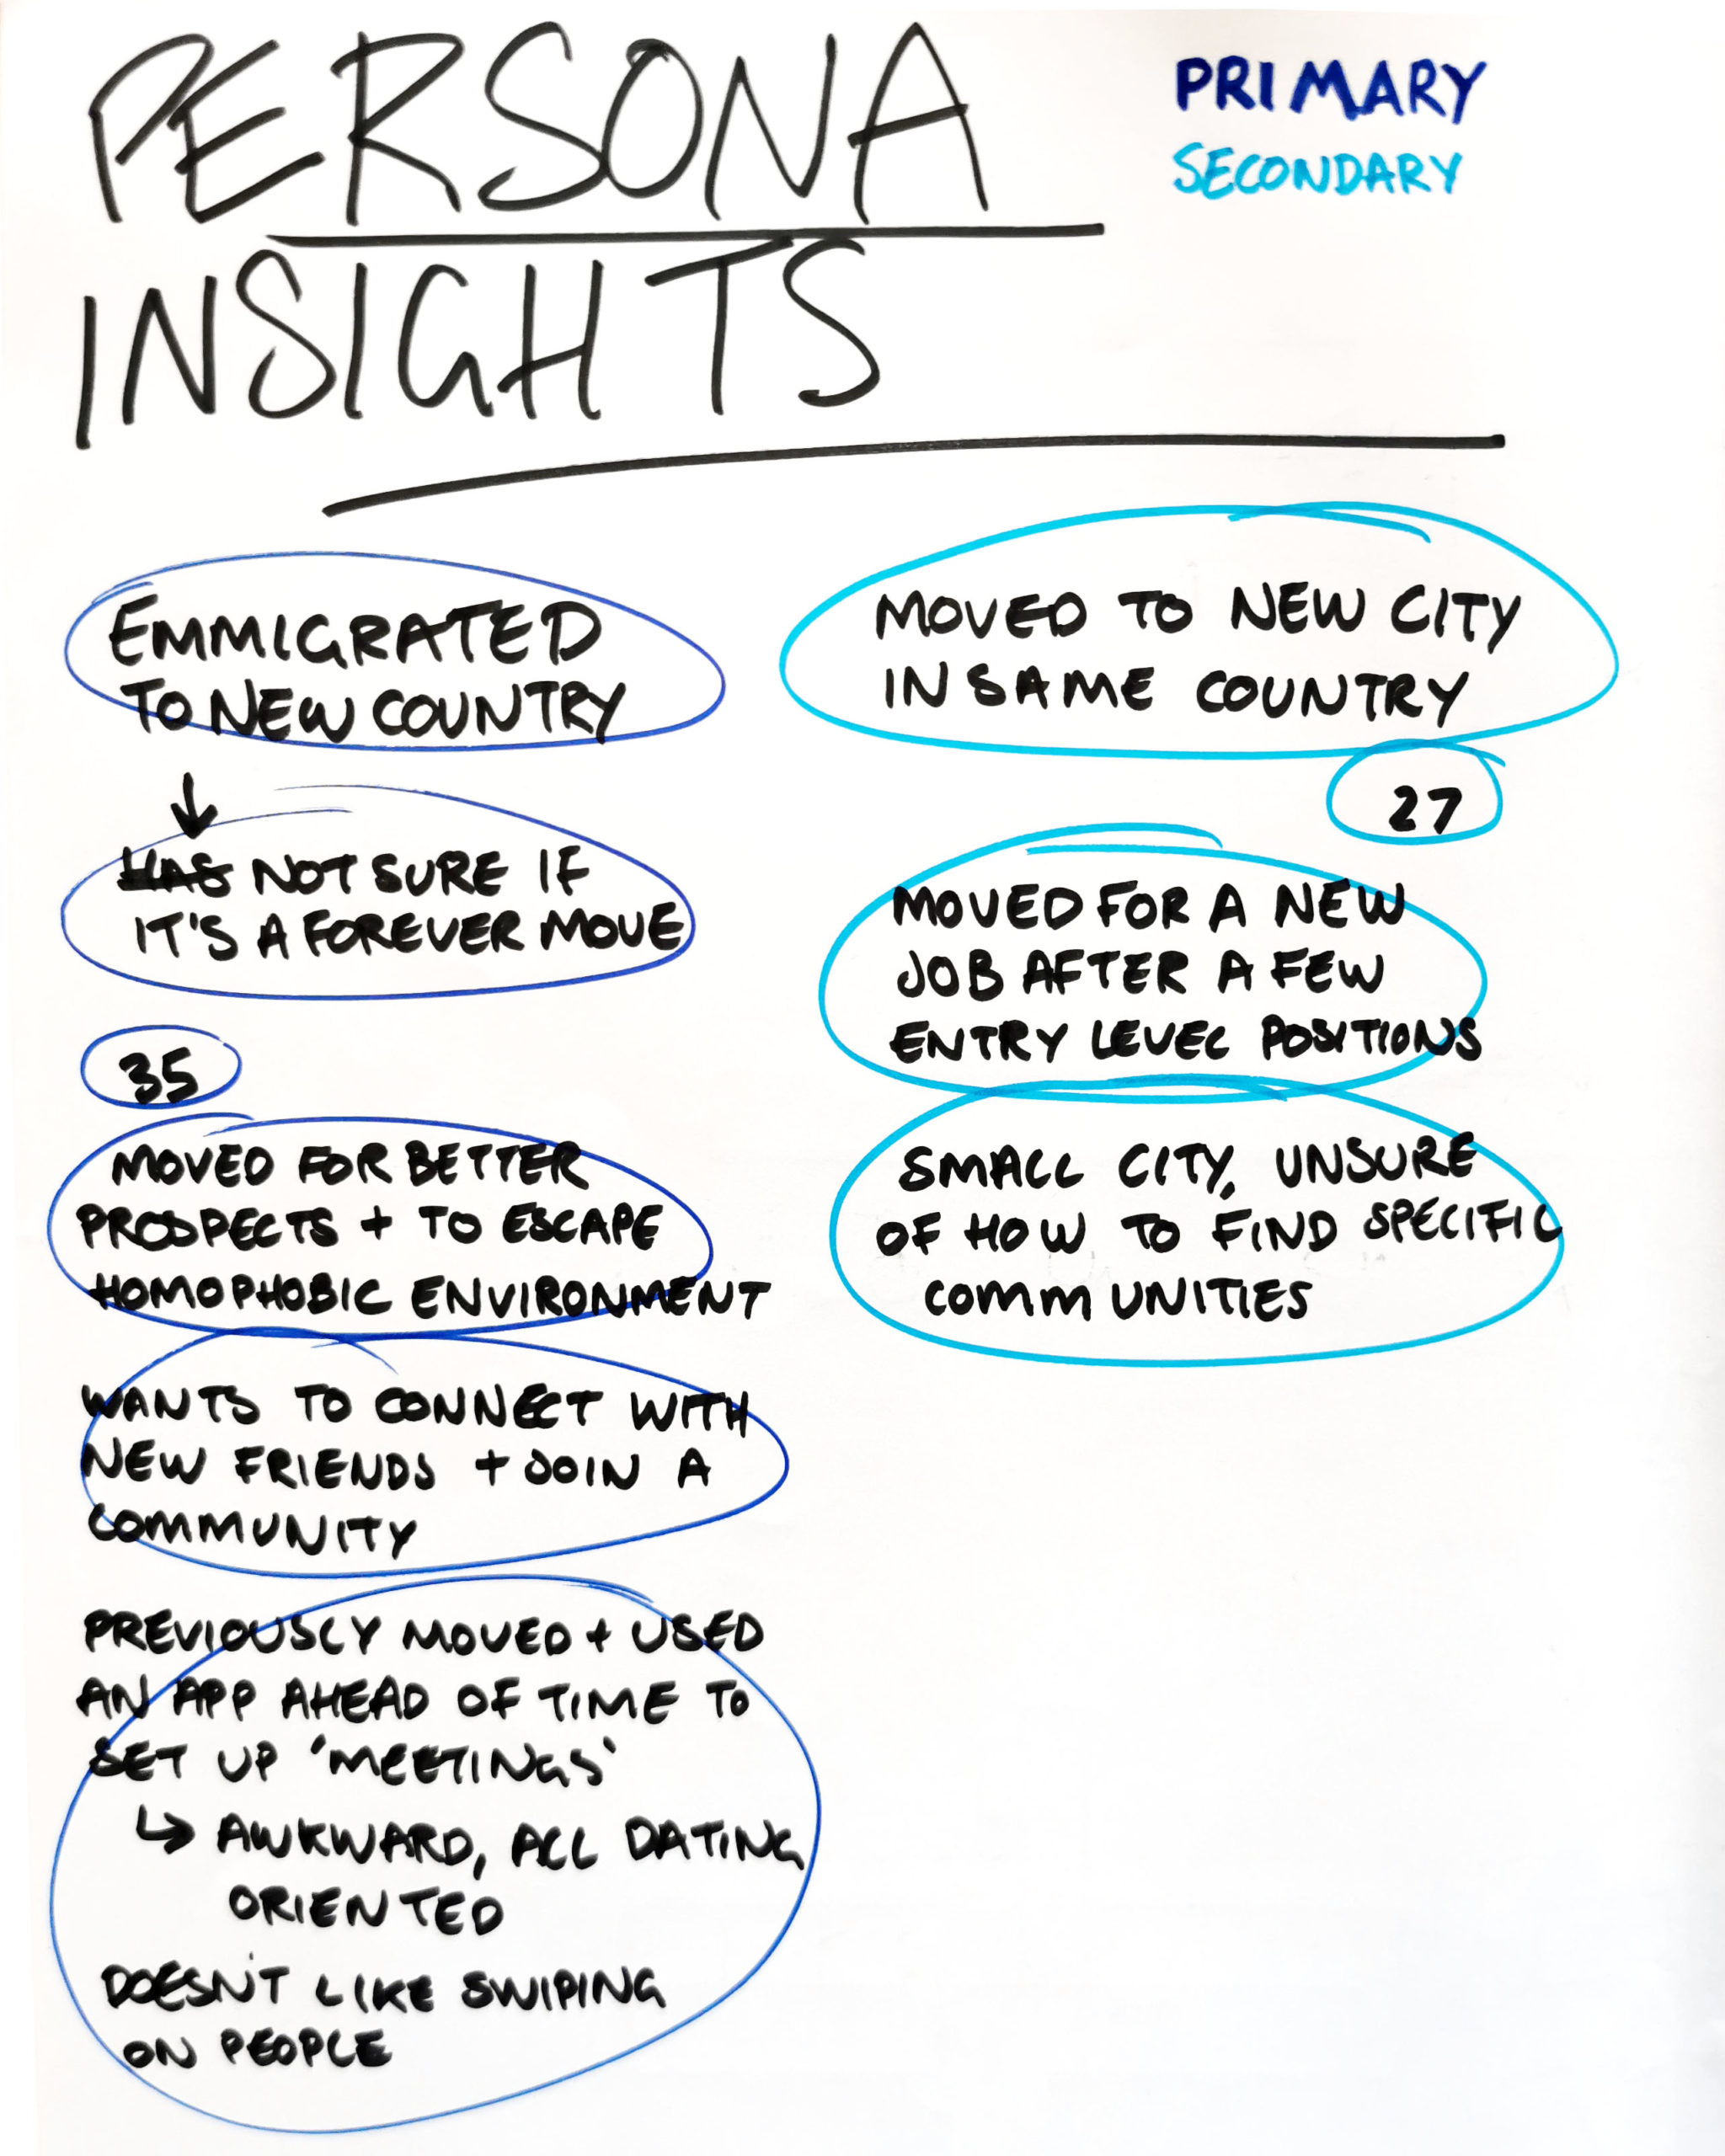
I started with the persona. Having just completed the research module with more than 80 responses full of data from which to make my personas, I found this tricky! I was lucky enough to interview five people; however, lacking a level of data saturation made me feel insecure about the accuracy of my data. Recognising this insecurity, I took a step back from creating the persona immediately and returned to my affinity map. Refocussing proved valuable as it reacquainted me with the data and allowed me to create a primary and secondary persona. Looking back, I see my insecurity could have stemmed from a lack of experience dealing with interview data. Taking a moment to look back at the original insights made me even more familiar with the data and helped me shake off new assumptions I was starting to make (Braun and Clarke 2006).
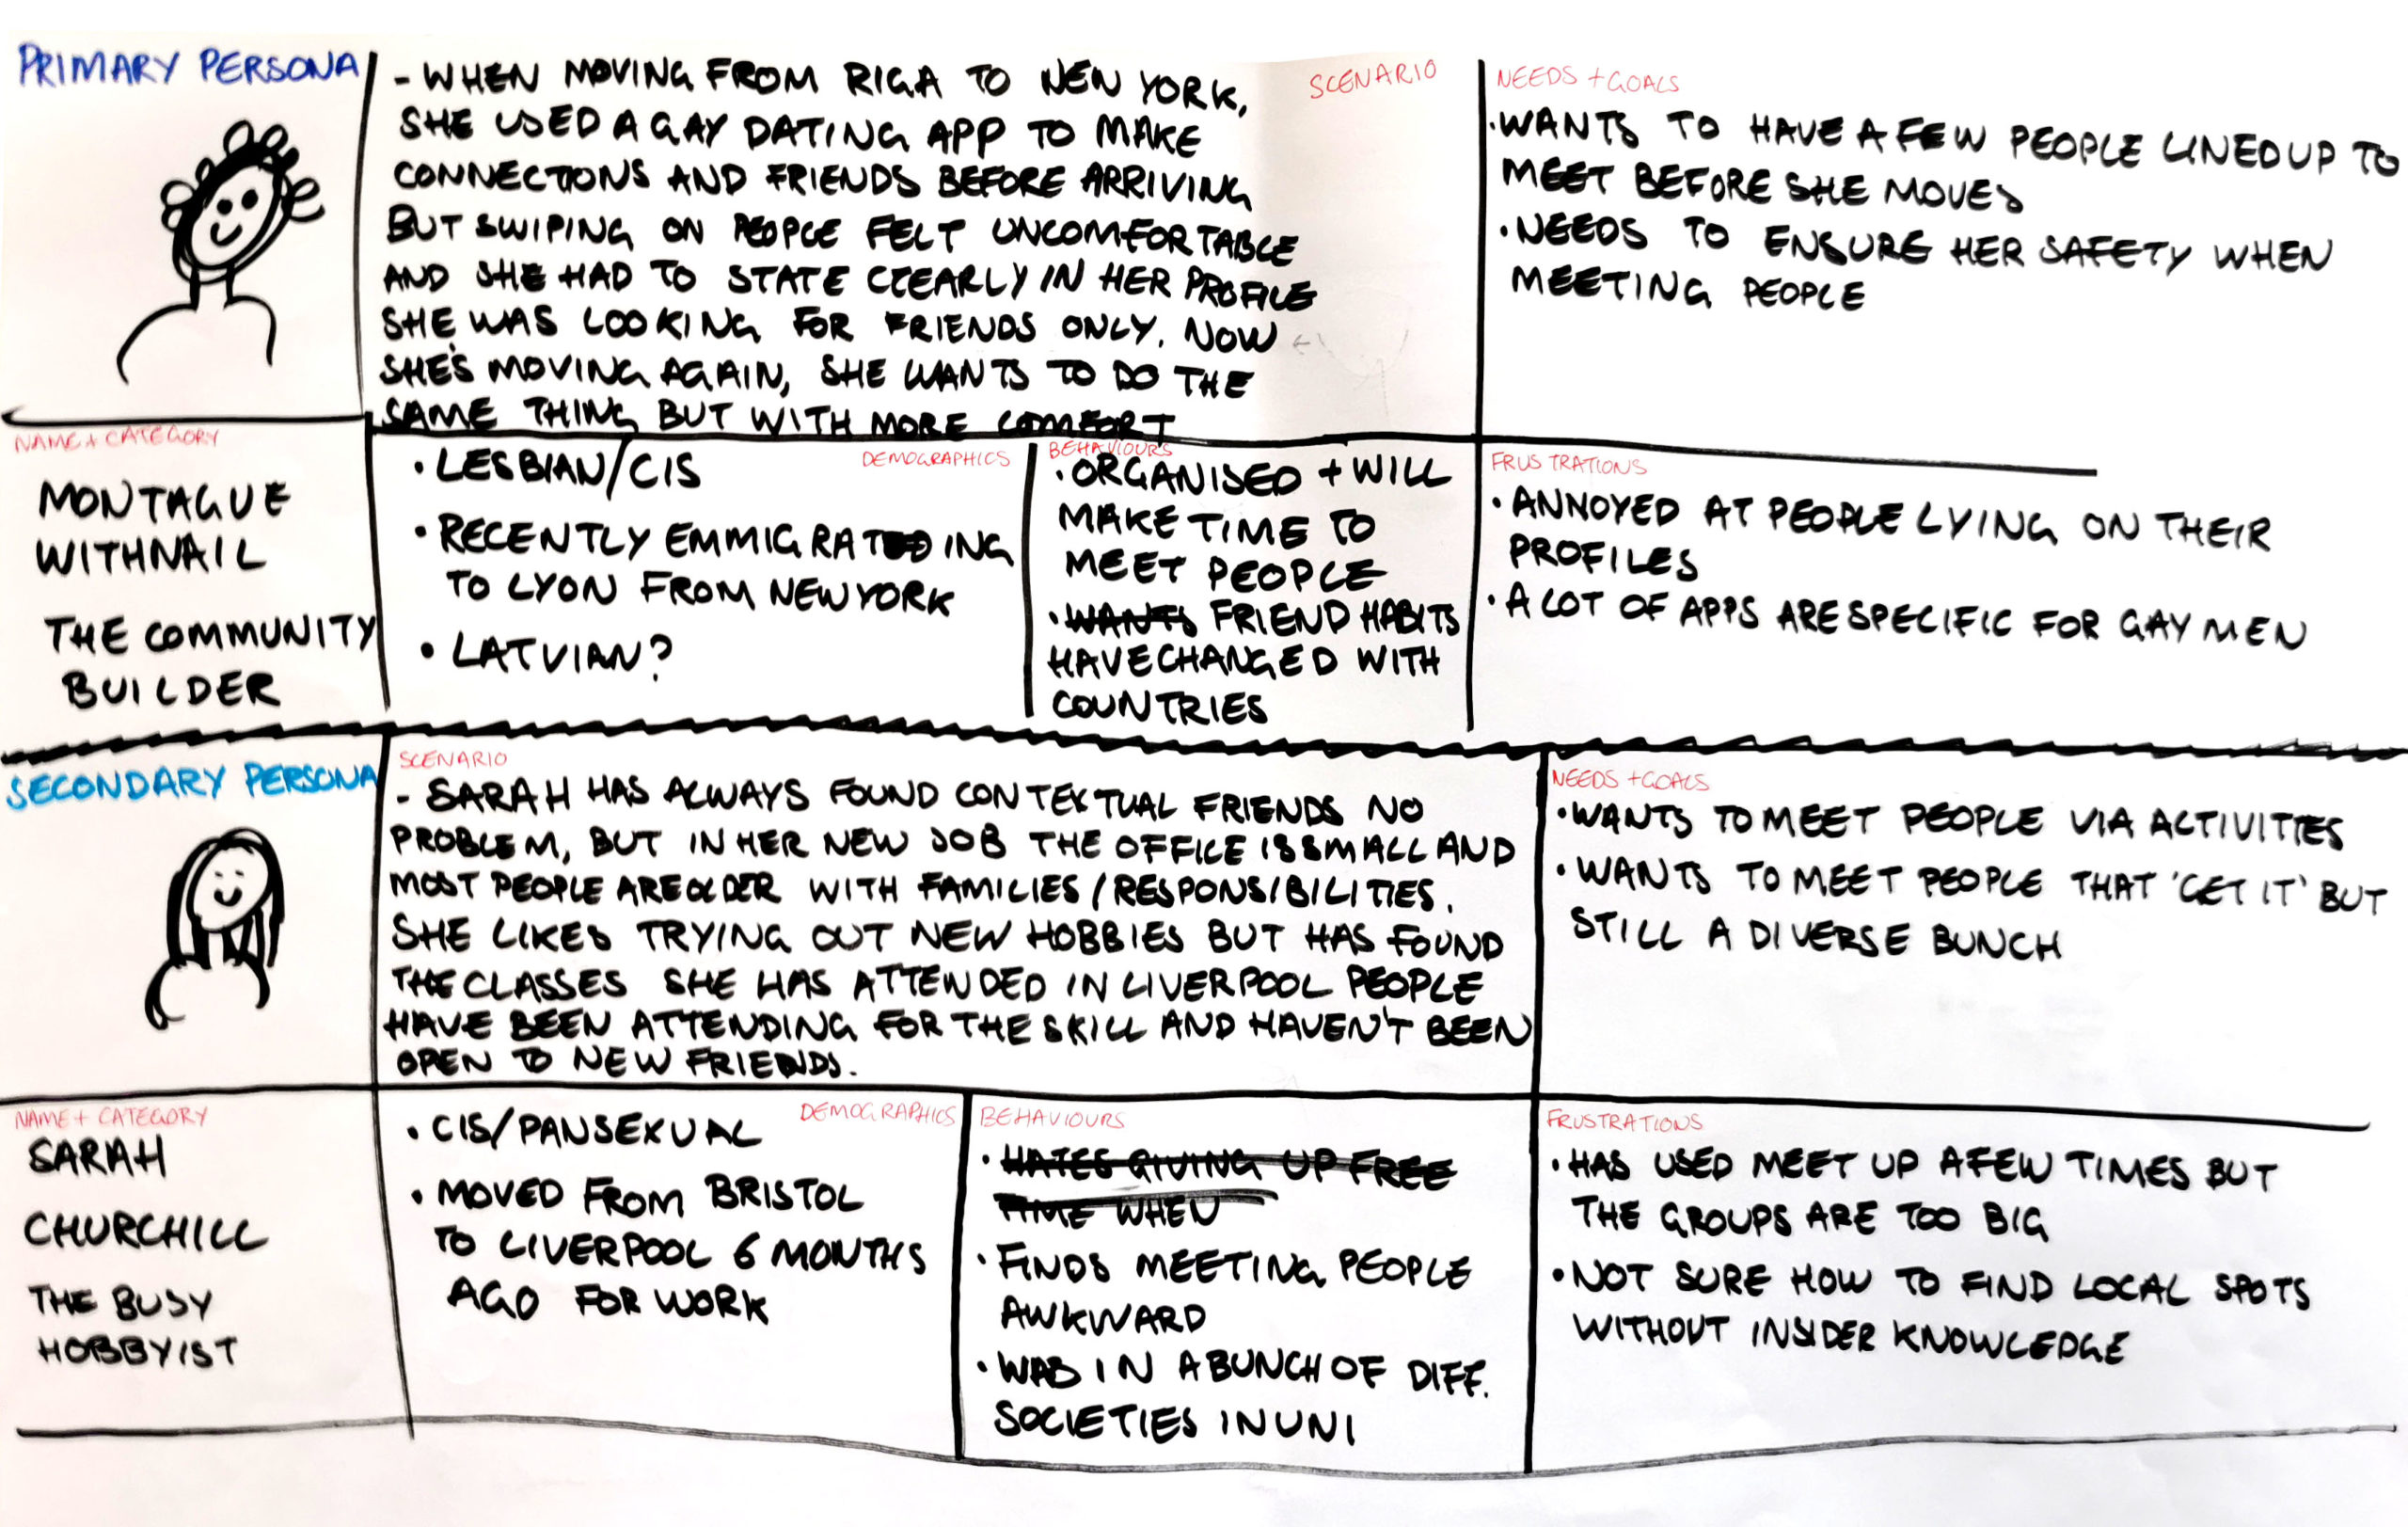
My primary and secondary personas, they will remain as sketches for now and will be adapted throughout the project
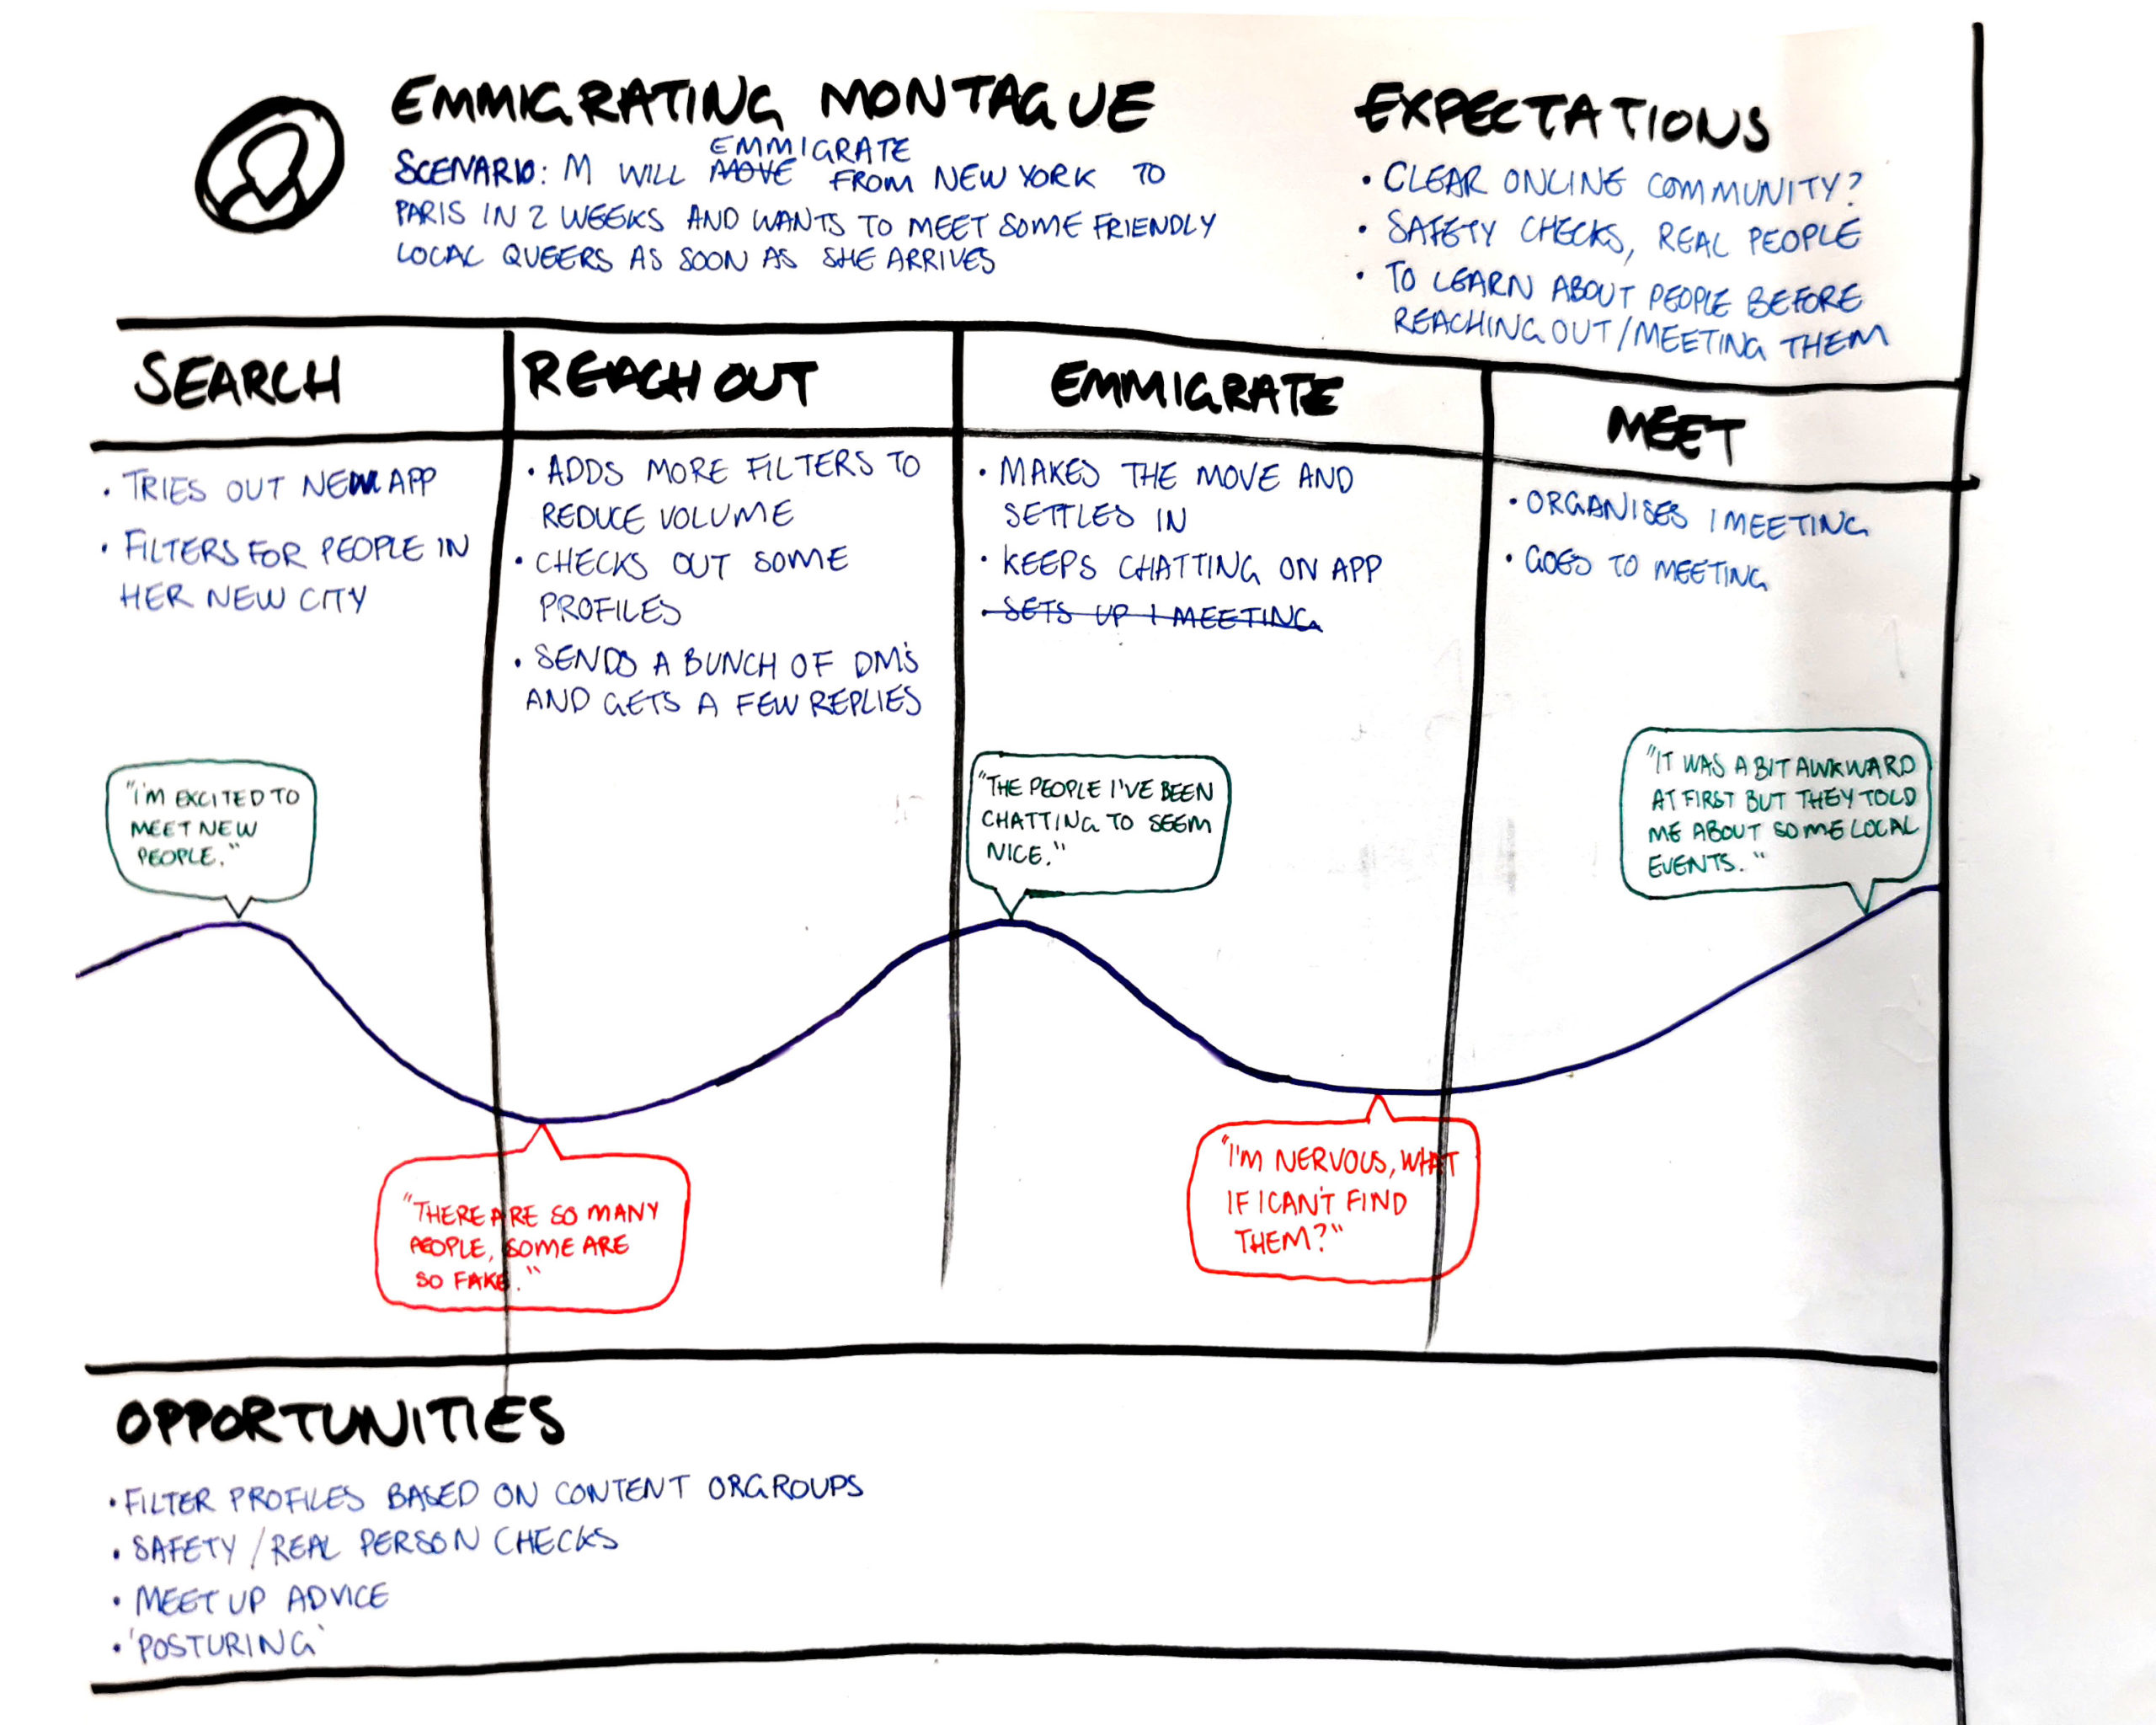
With the personas in hand, I returned to week 2’s tasks and created a journey map for the primary persona. I kept it simple and used the template from NN/g (Gibbons 2018). At first, I only used the column layout as I didn’t see the need for the emotion line. However, when I saw an example of a journey map from a fellow student without the emotion line, the map was suddenly much more challenging to understand!
Overall, it was a great exercise to figure out the steps a user goes through to achieve their goal, but what I found really interesting was thinking about how the user might be feeling at different moments. The red speech bubble that says, “I’m nervous, what if I can’t find them?” came from an interview participant and helps to highlight that a product might need to provide extra support at that stage. The journey map helped me understand the Customer Experience (CX) process better, as I had to zoom out and look at what might be happening outside of the product. Looking forwards, I will make the effort to complete a customer journey map first, as I think that will help focus the following steps. I will also clarify a goal for the map first and what I hope to achieve by creating it (Browne 2021).
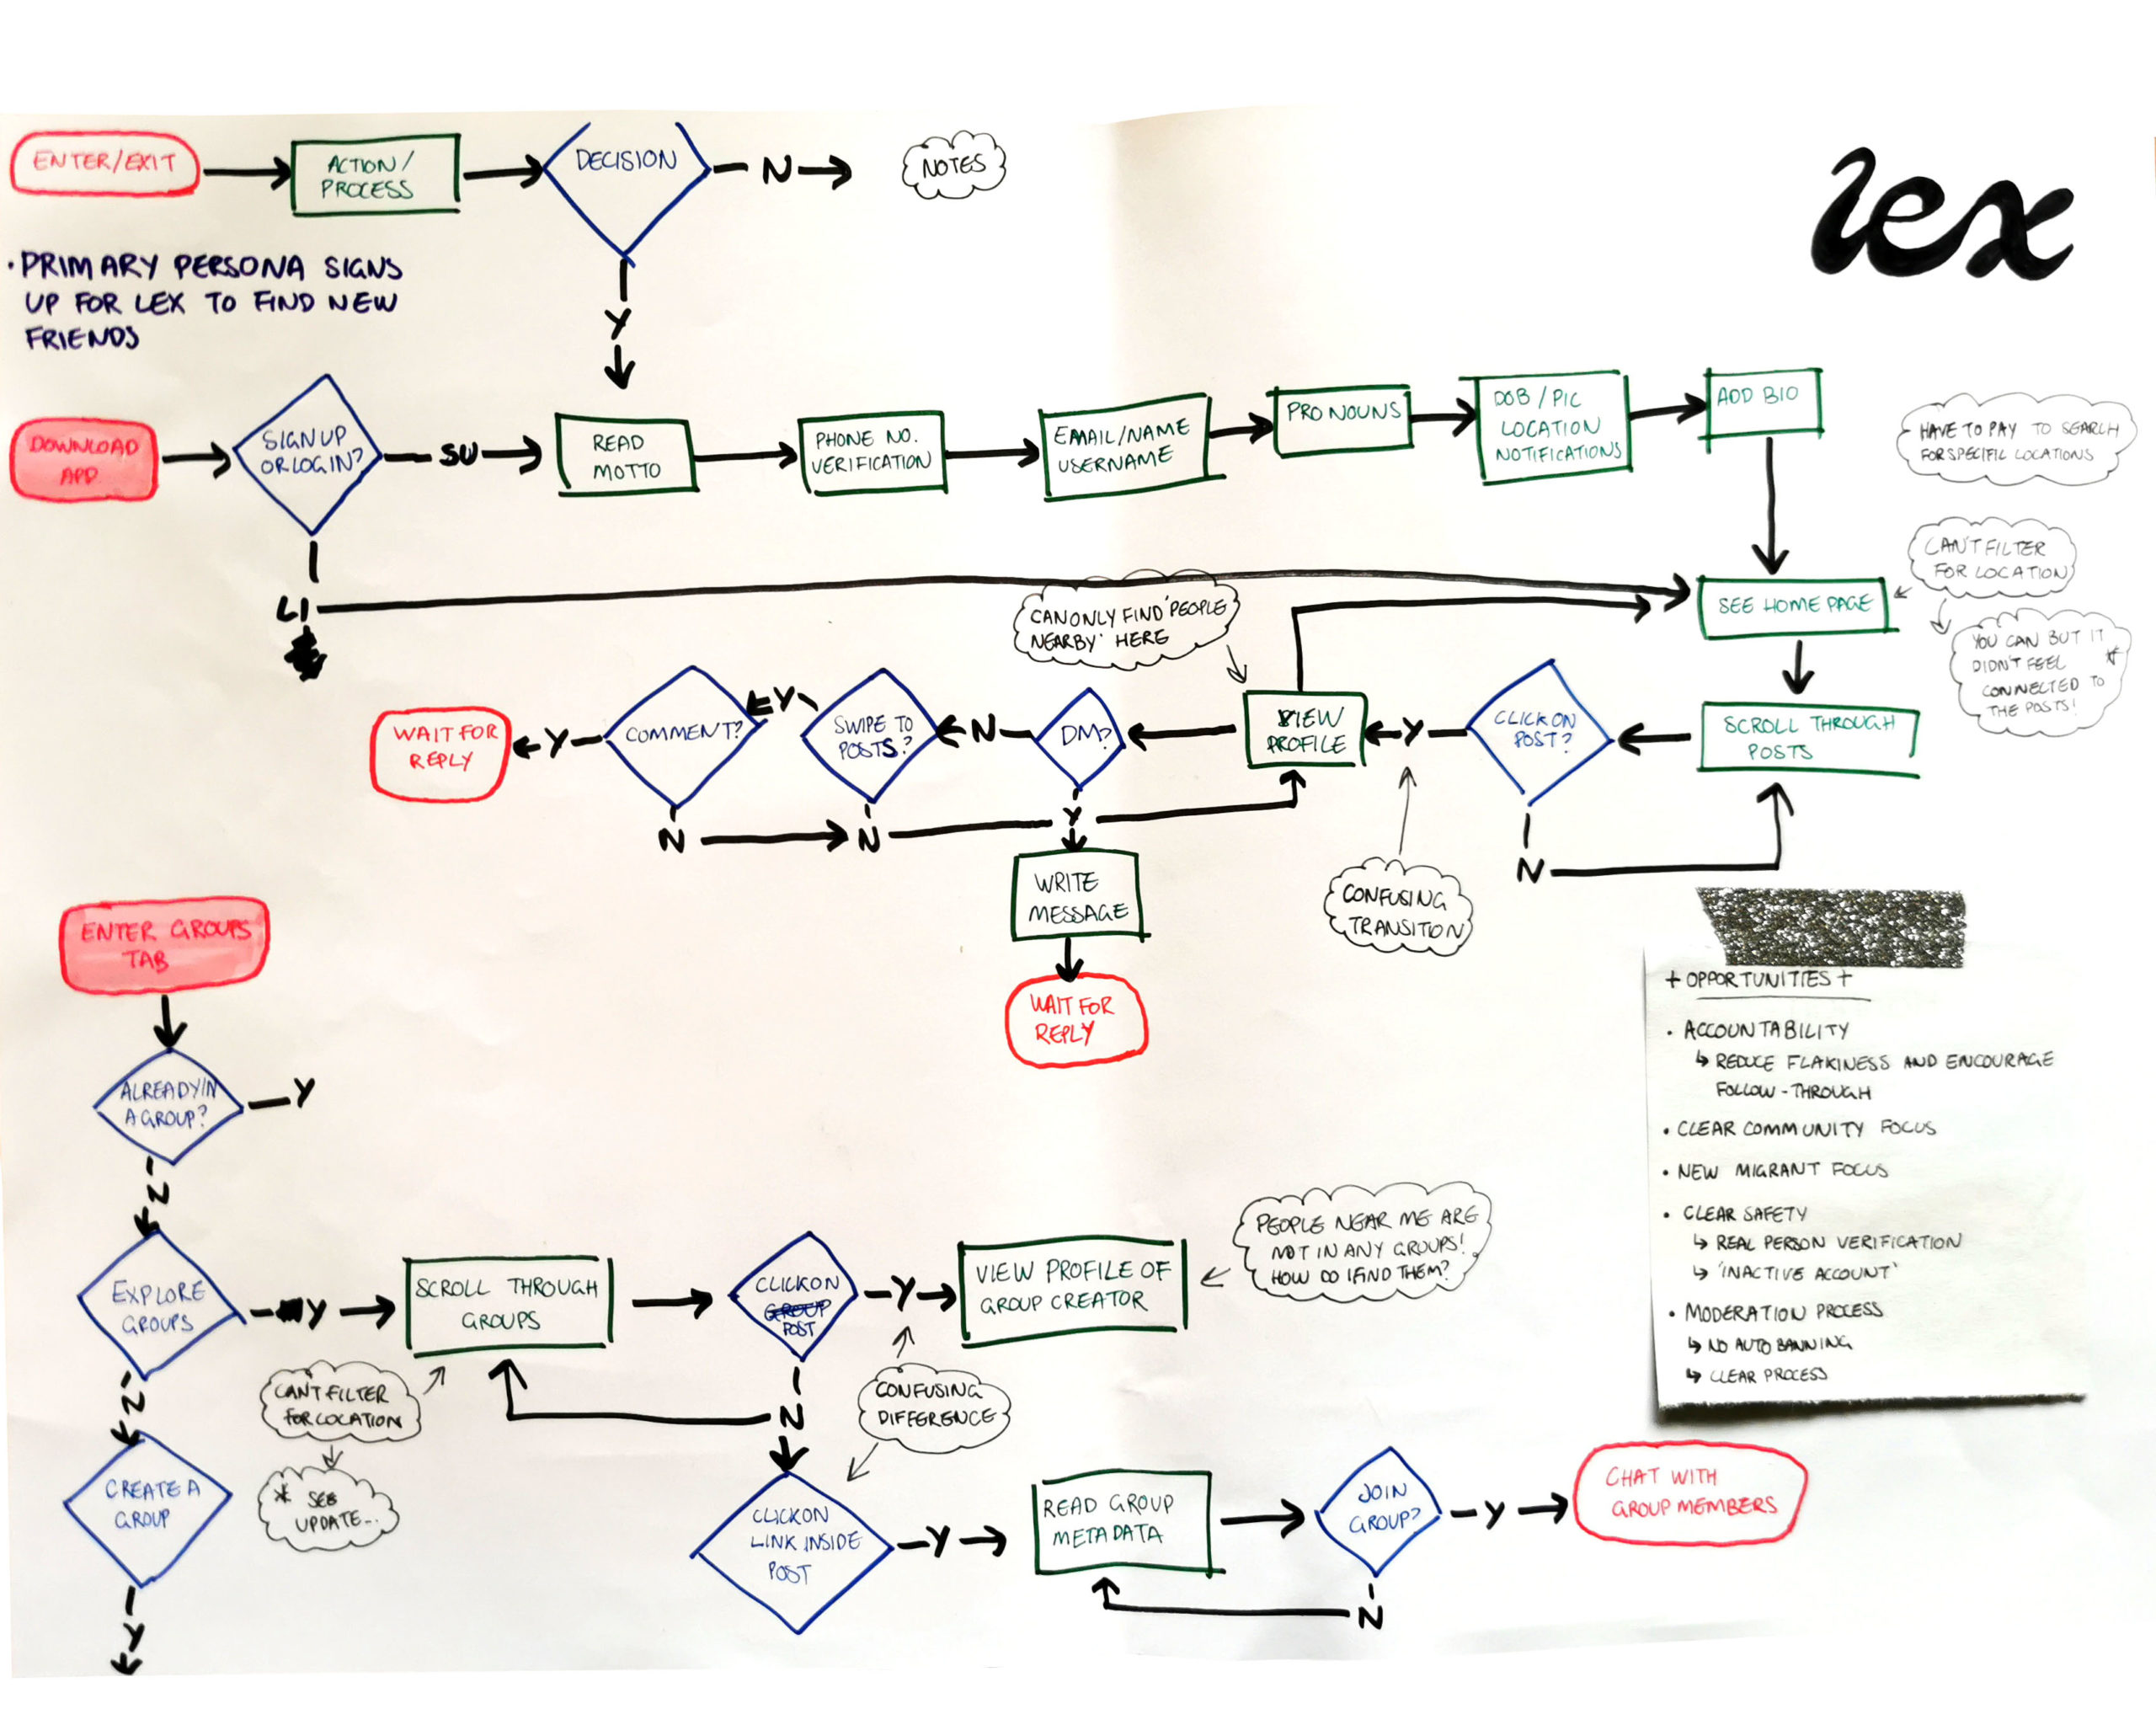
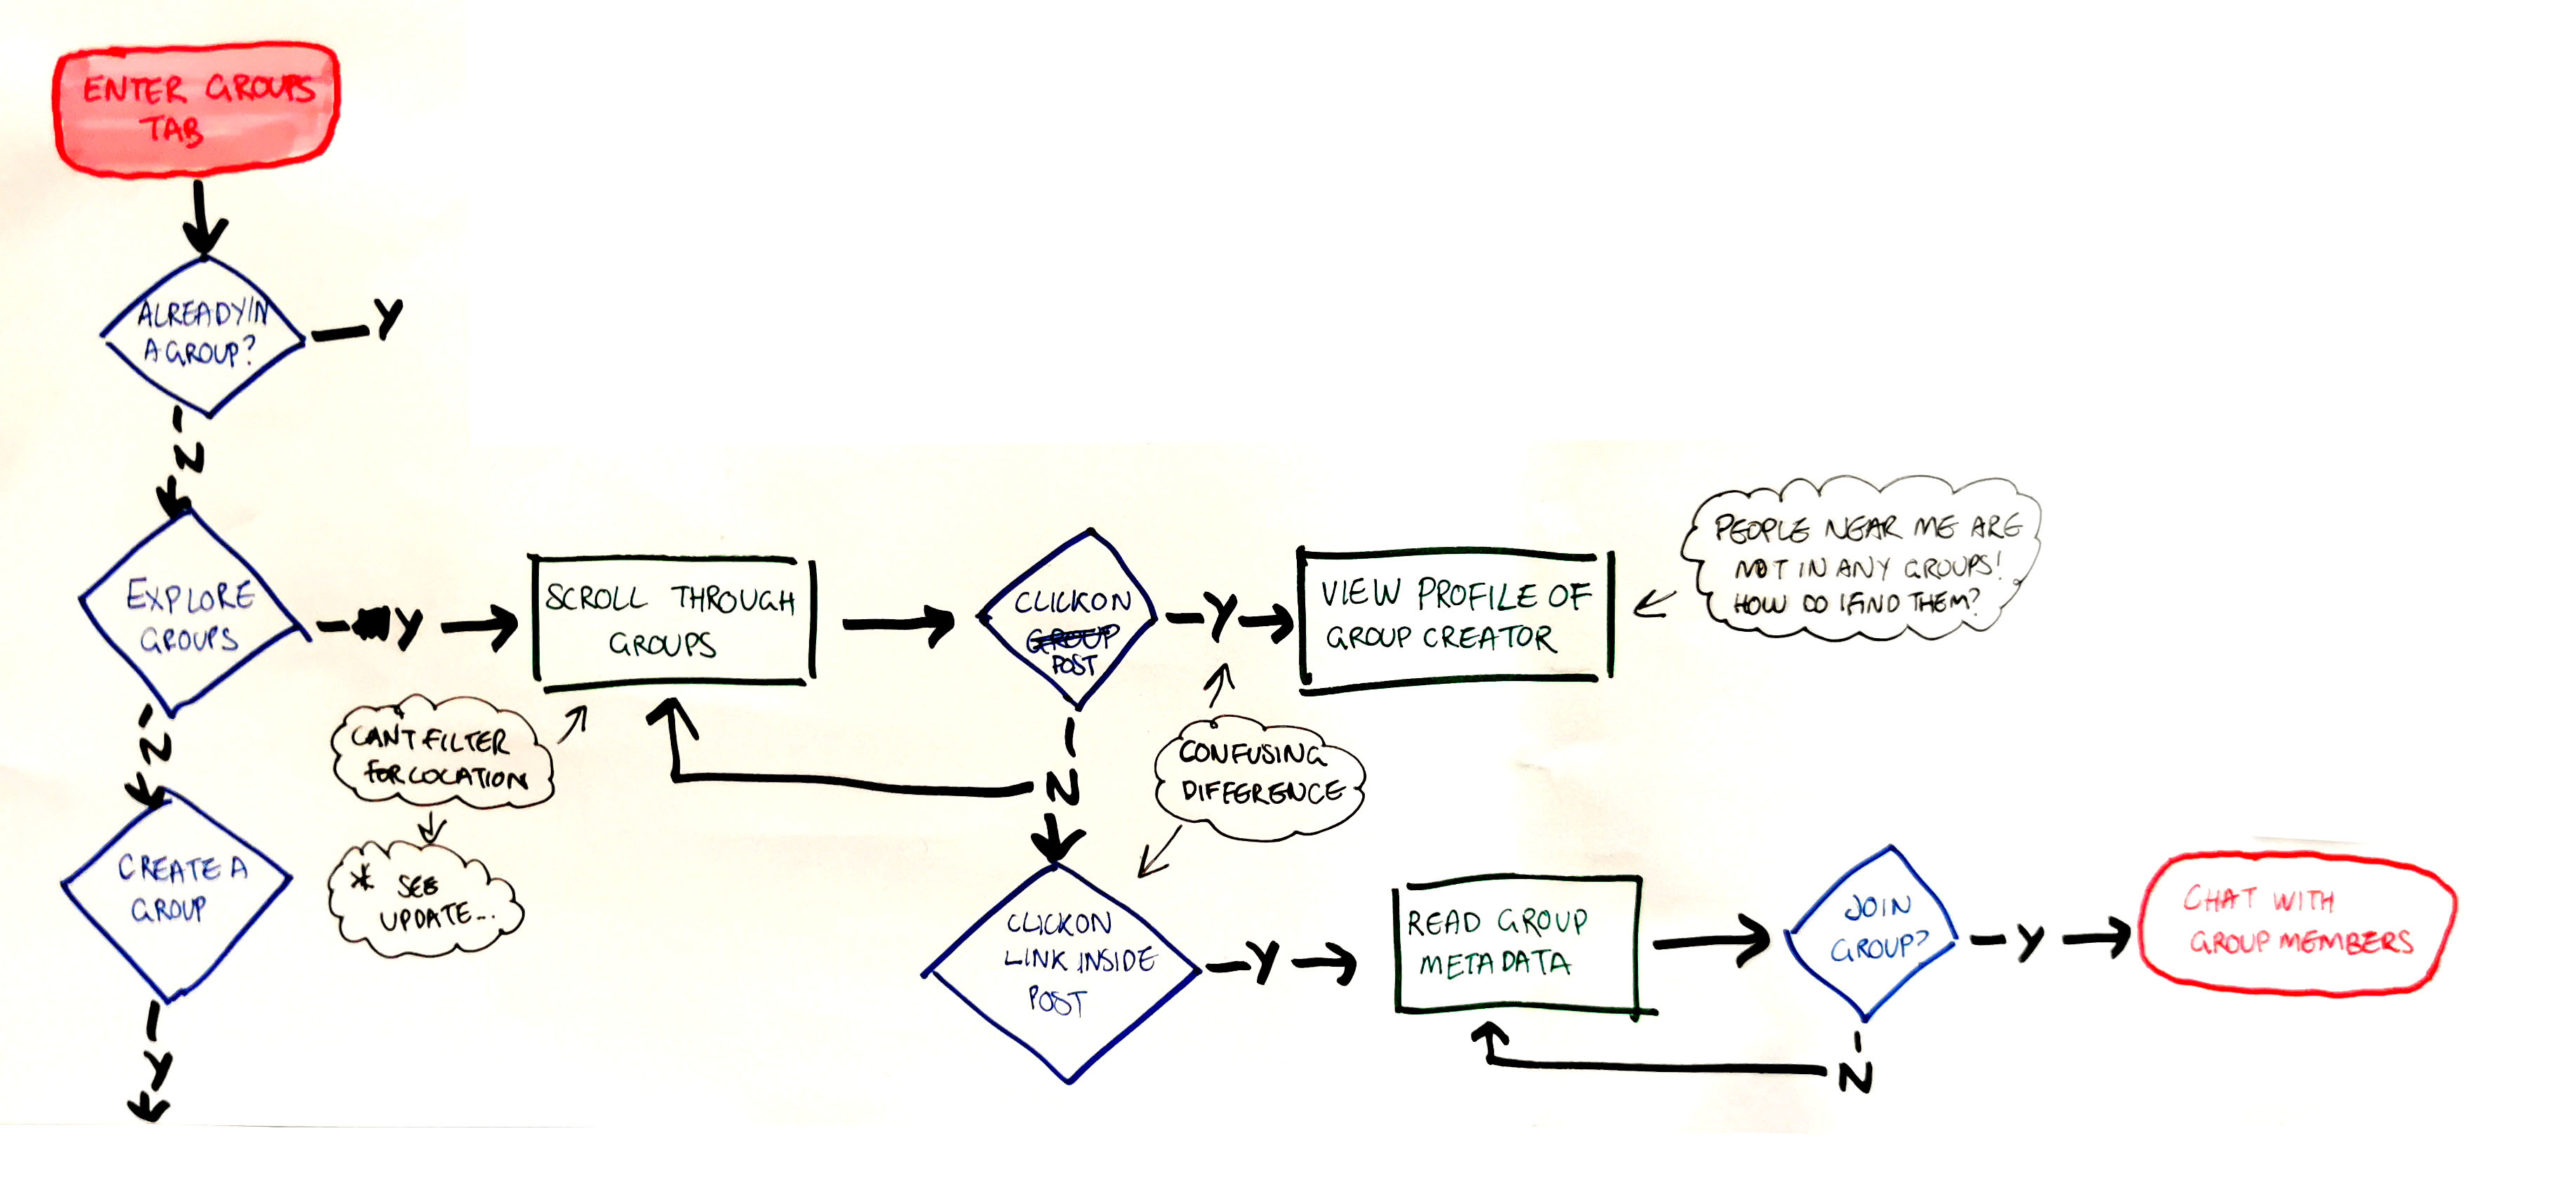
Turning to some real-world products, I analysed two user flows in Lex, a queer dating/community platform (Lex 2024). Using my primary persona, I examined the flow between signing up and messaging someone and how a user joins a group. Flow analysis was very illuminating as it helped me identify a few problem areas with the flow that would make new users unsure of how to proceed. I enjoyed the deconstruction of analysing a user flow, as it let me see how much goes into making one small section of a product and how easy it is for usability problems to creep in during the design process (Higgs 2003).
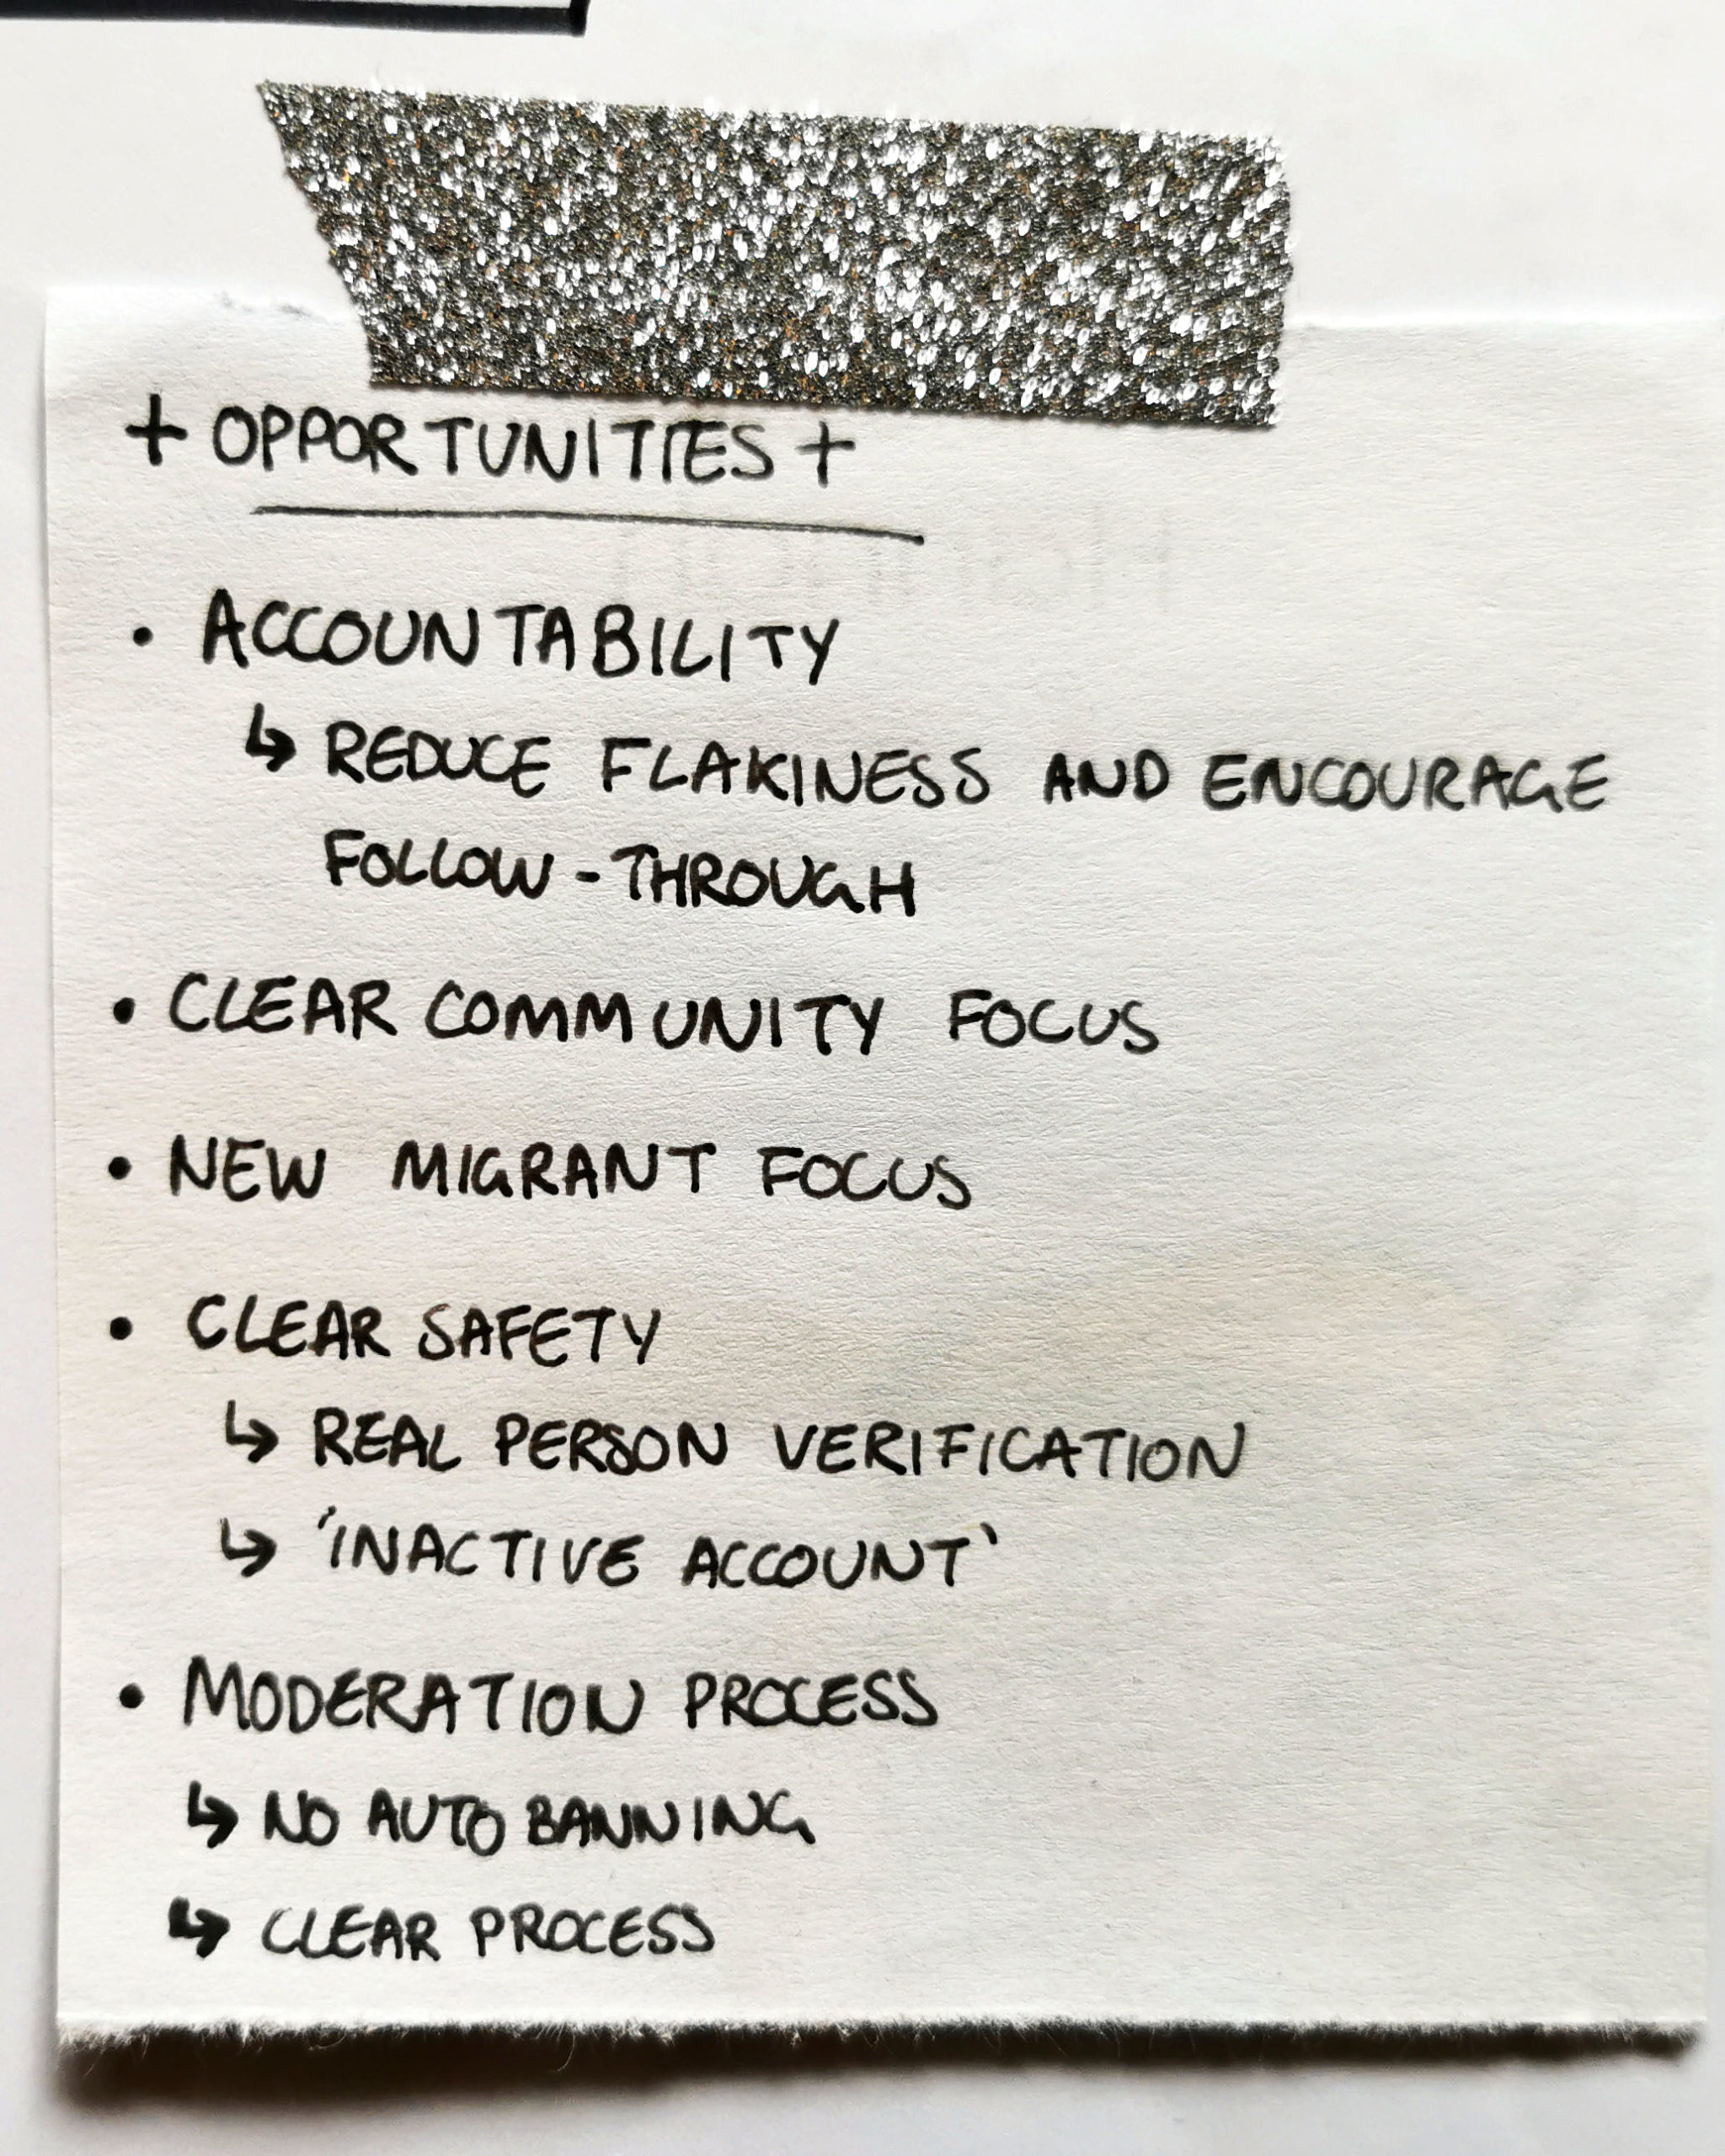
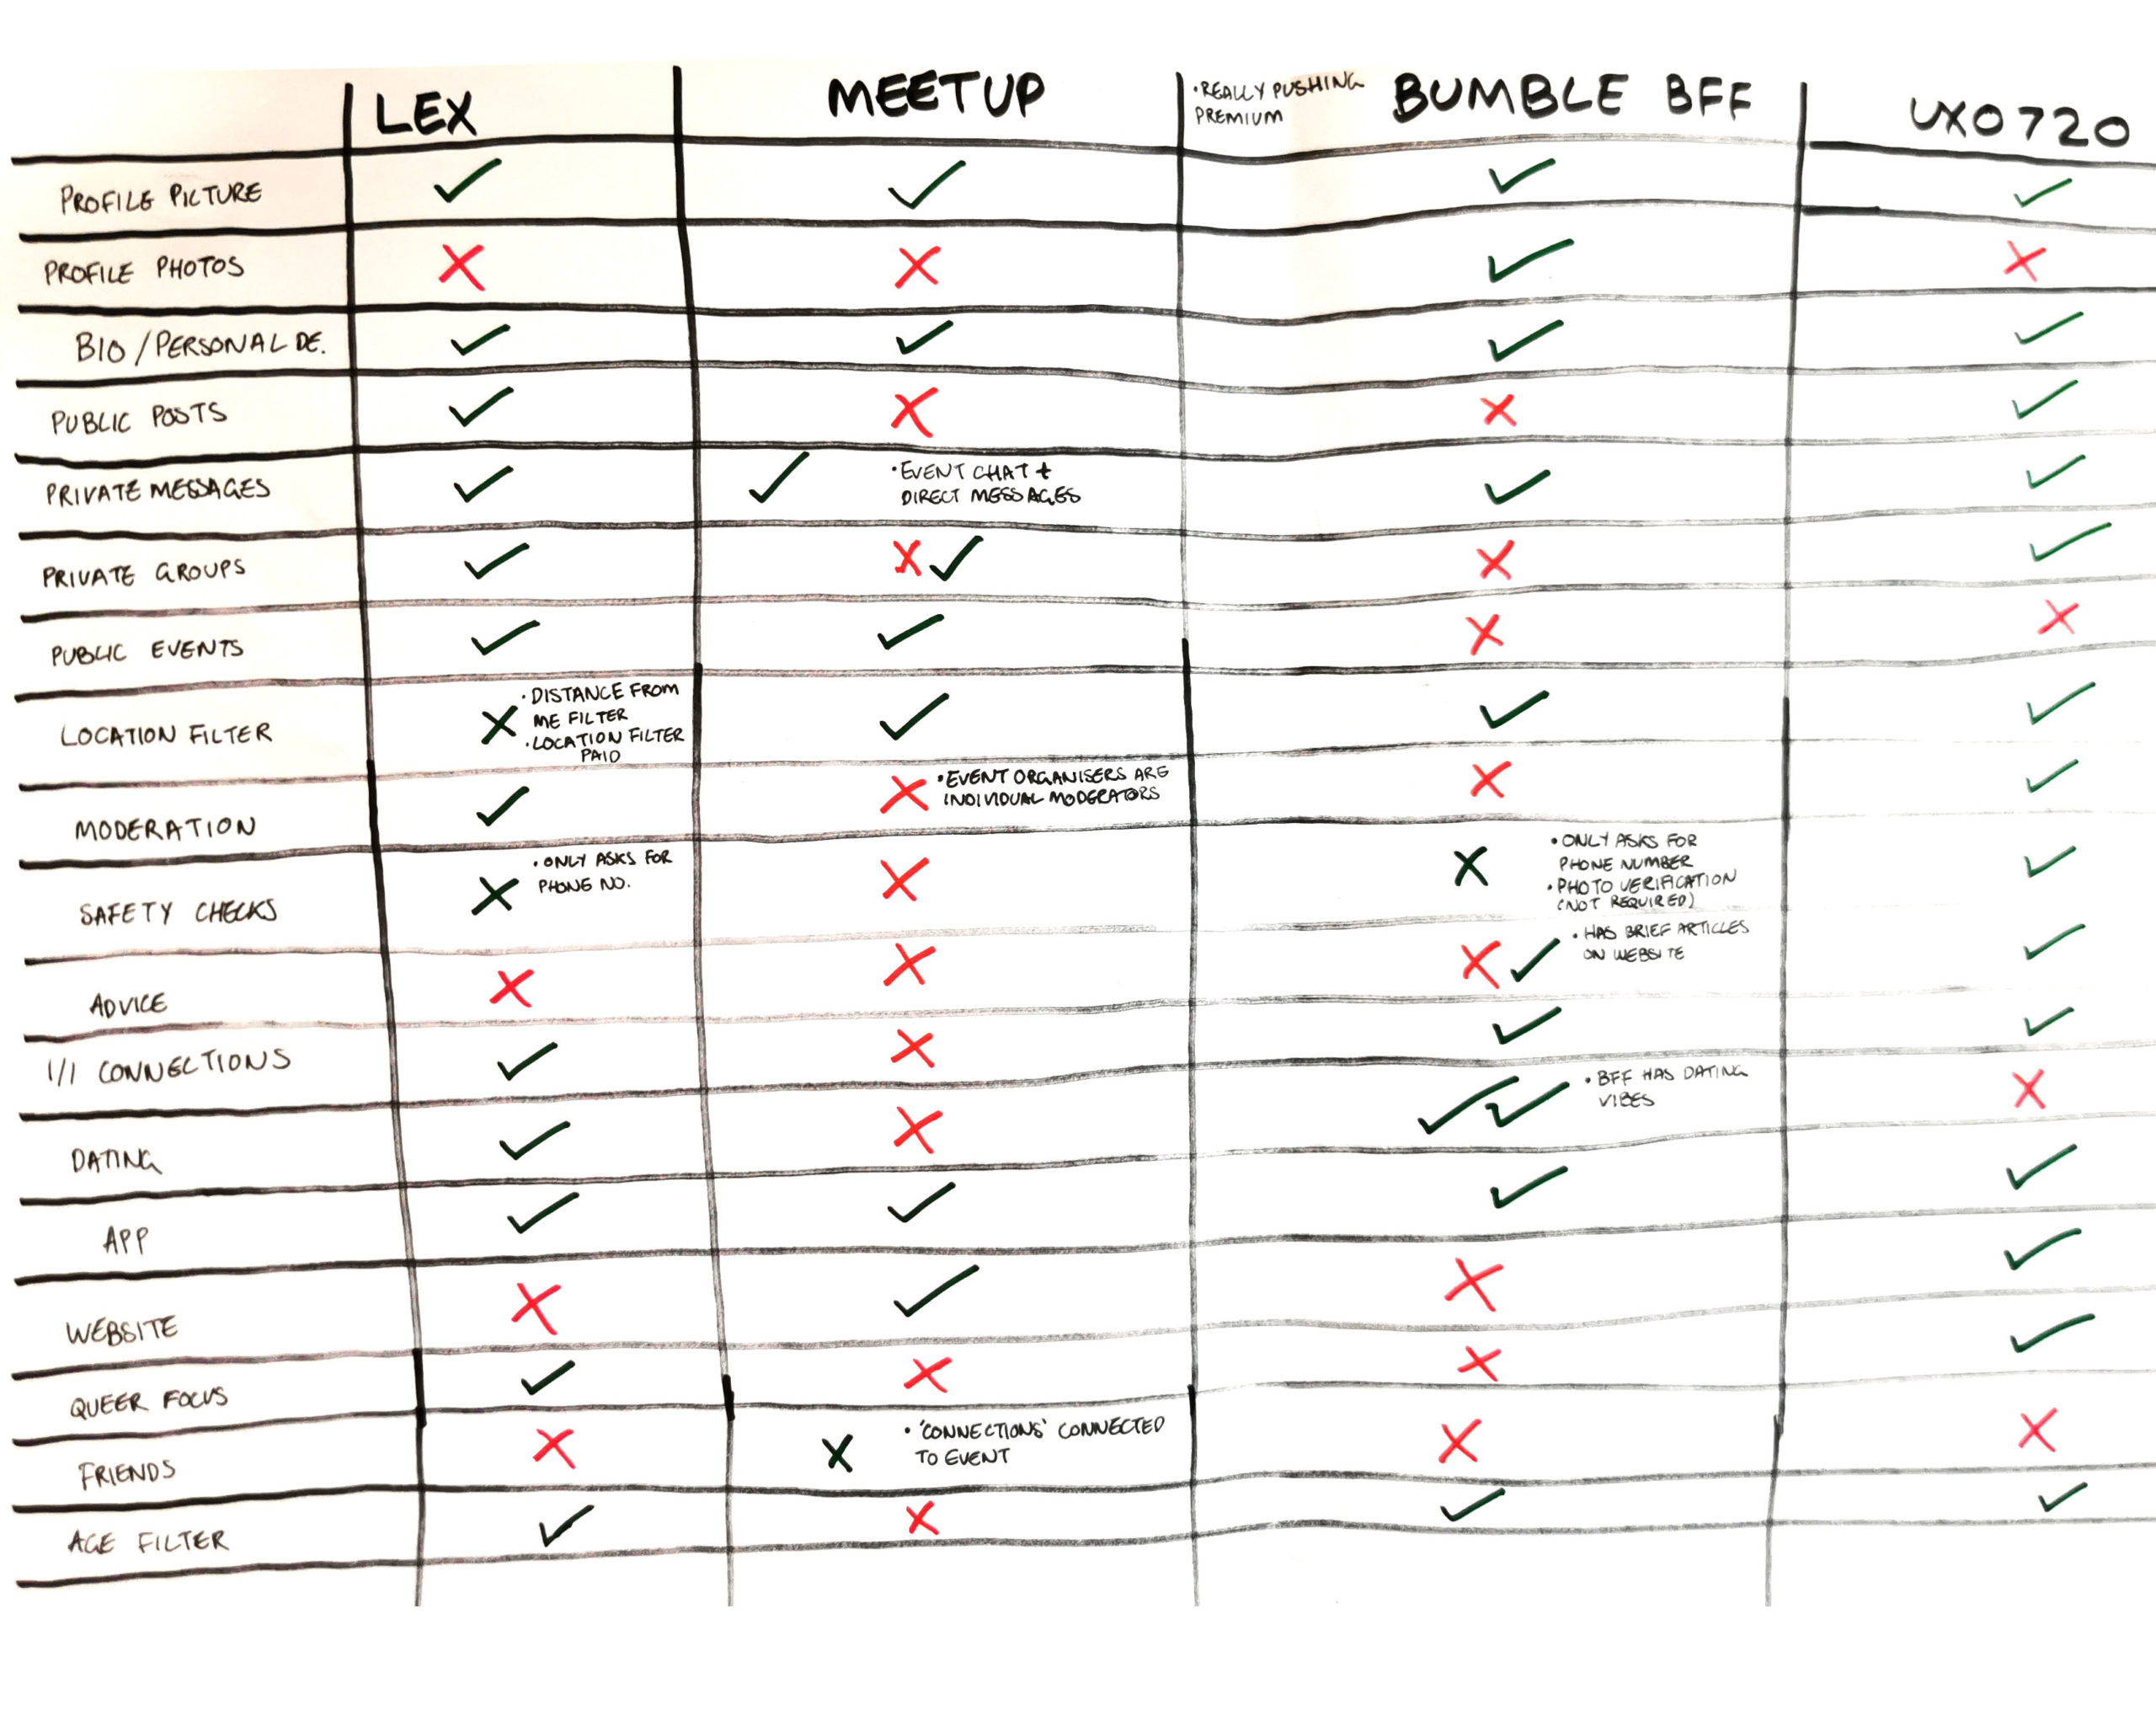
The combination of the journey map and the user flow also helped me identify key opportunities for my product, which I might not have seen without stepping into the user’s shoes. Despite being focused on the queer community, the only safety protocols in place were adding a phone number, and the app has not provided any advice on in-person meetups.
Taking the lead from my interview participants, I sought out the leaders in this area, Lex, MeetUp and Bumble BFF.
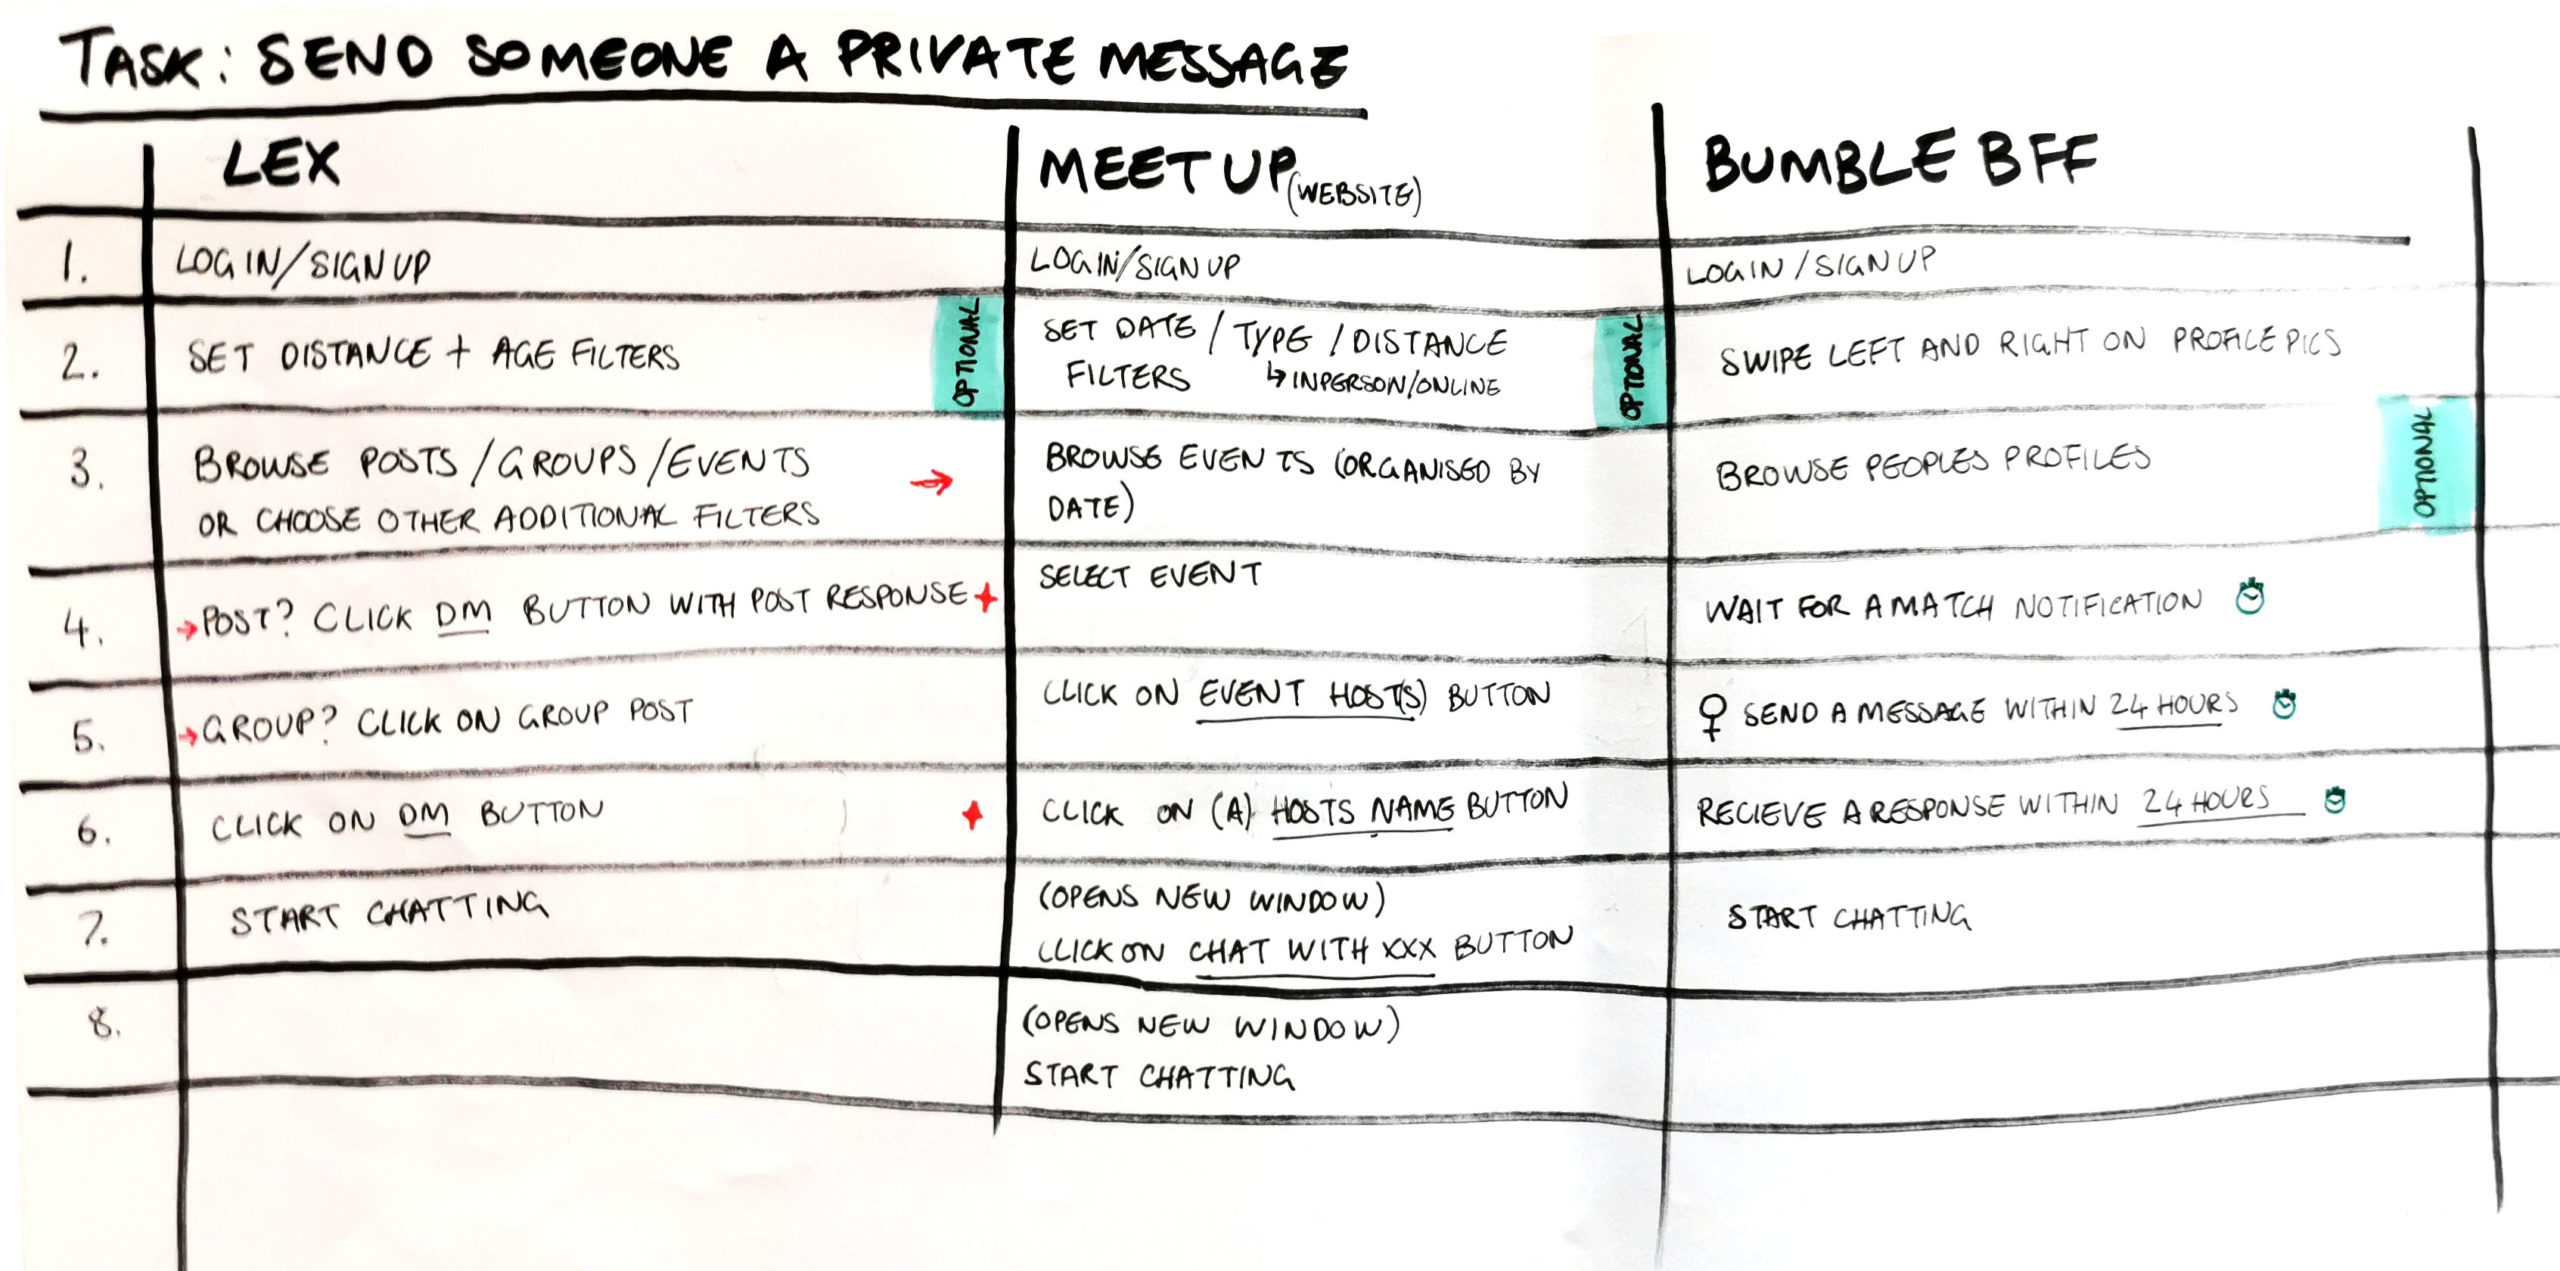
Each product very quickly gave different vibes regarding values, which led me to identify which features I would like to include in my artefact. As one of the key values for my project is making meaningful connections with people, I conducted a task analysis into how each product treats its direct messaging (DM) function.
The different breakdowns of the same task again highlighted significant differences in product values. Despite being a feature in Meetup, it was tricky to message people and didn’t follow an easy or logical flow.
Conclusion
Based on these tasks, I want to:
Create a product dedicated to platonic friendship that supports protecting safety and holding members accountable when someone new reaches out to them.
Users mentioned ‘ghosting’ as a problem in FAQ pages, so I would like to find an empathetic way to add that as a key feature without the complicated, 24-hour silliness of Bumble.
I would like to mirror the simplicity of the chat function in Lex. However, it feels minimal as an app due to its inspiration for newspaper personals. Something that gives users a fuller feeling might also encourage new users. However, I would like to test that assumption further.
I really enjoyed these tasks and how they gradually funnelled into more specific analysis. Each task gave me a deeper insight into the problem area and where pain points still exist. Creating rough versions of each piece of documentation helped me get to grips with the situation much better, but I realise I won’t have that luxury in a work environment. Speed, however, will come with familiarity with the tasks.
Part of the reason I started these tasks with pen and paper was a reaction to the overwhelming feeling of creating documentation from scratch. I know there are templates available, but I want my work to challenge and surprise viewers while simultaneously representing my users. Again, increasing my familiarity with this kind of documentation will only benefit me.
Therefore, using the SMART framework (Lawlor 2012), I aim to return to my previous Falmouth projects and create retroactive UX documentation for each project. I will create journey maps, user flows, and competitive analyses (and personas for the more established projects) for each project. Returning to projects I’m already familiar with will help me quickly see the benefits and opportunities for completing UX documentation. As this will be additional work to my studies, I will endeavour to complete it by the end of December 2024.
References
BRAUN, Virginia and Victoria CLARKE. 2006. ‘Using Thematic Analysis in Psychology’. Qualitative Research in Psychology 3(2), 77–101.
BROWNE, Camren. 2021. ‘7 Steps To Build a Customer Journey Map’. Career Foundry [online]. Available at: https://careerfoundry.com/en/blog/ux-design/how-to-make-customer-journey-map-with-template/ [accessed 12 Feb 2024].
GIBBONS, Sarah. 2018. ‘Journey Mapping 101’. Nielsen Norman Group [online]. Available at: https://www.nngroup.com/articles/journey-mapping-101/ [accessed 9 Feb 2024].
HIGGS, Philip. 2003. ‘Deconstruction and Re-Thinking Education’. South African Journal of Education 22(3).
LAWLOR, K. Blaine. 2012. ‘Smart Goals: How the Application of Smart Goals Can Contribute to Achievement of Student Learning Outcomes’. Developments in Business Simulation and Experiential Learning: Proceedings of the Annual ABSEL conference 39, 259–67.
LEX. 2024. ‘Lex’. [online]. Available at: https://www.lex.lgbt/ [accessed 9 Feb 2024].
German vocabulary of the week
Catch up – Aufholen

