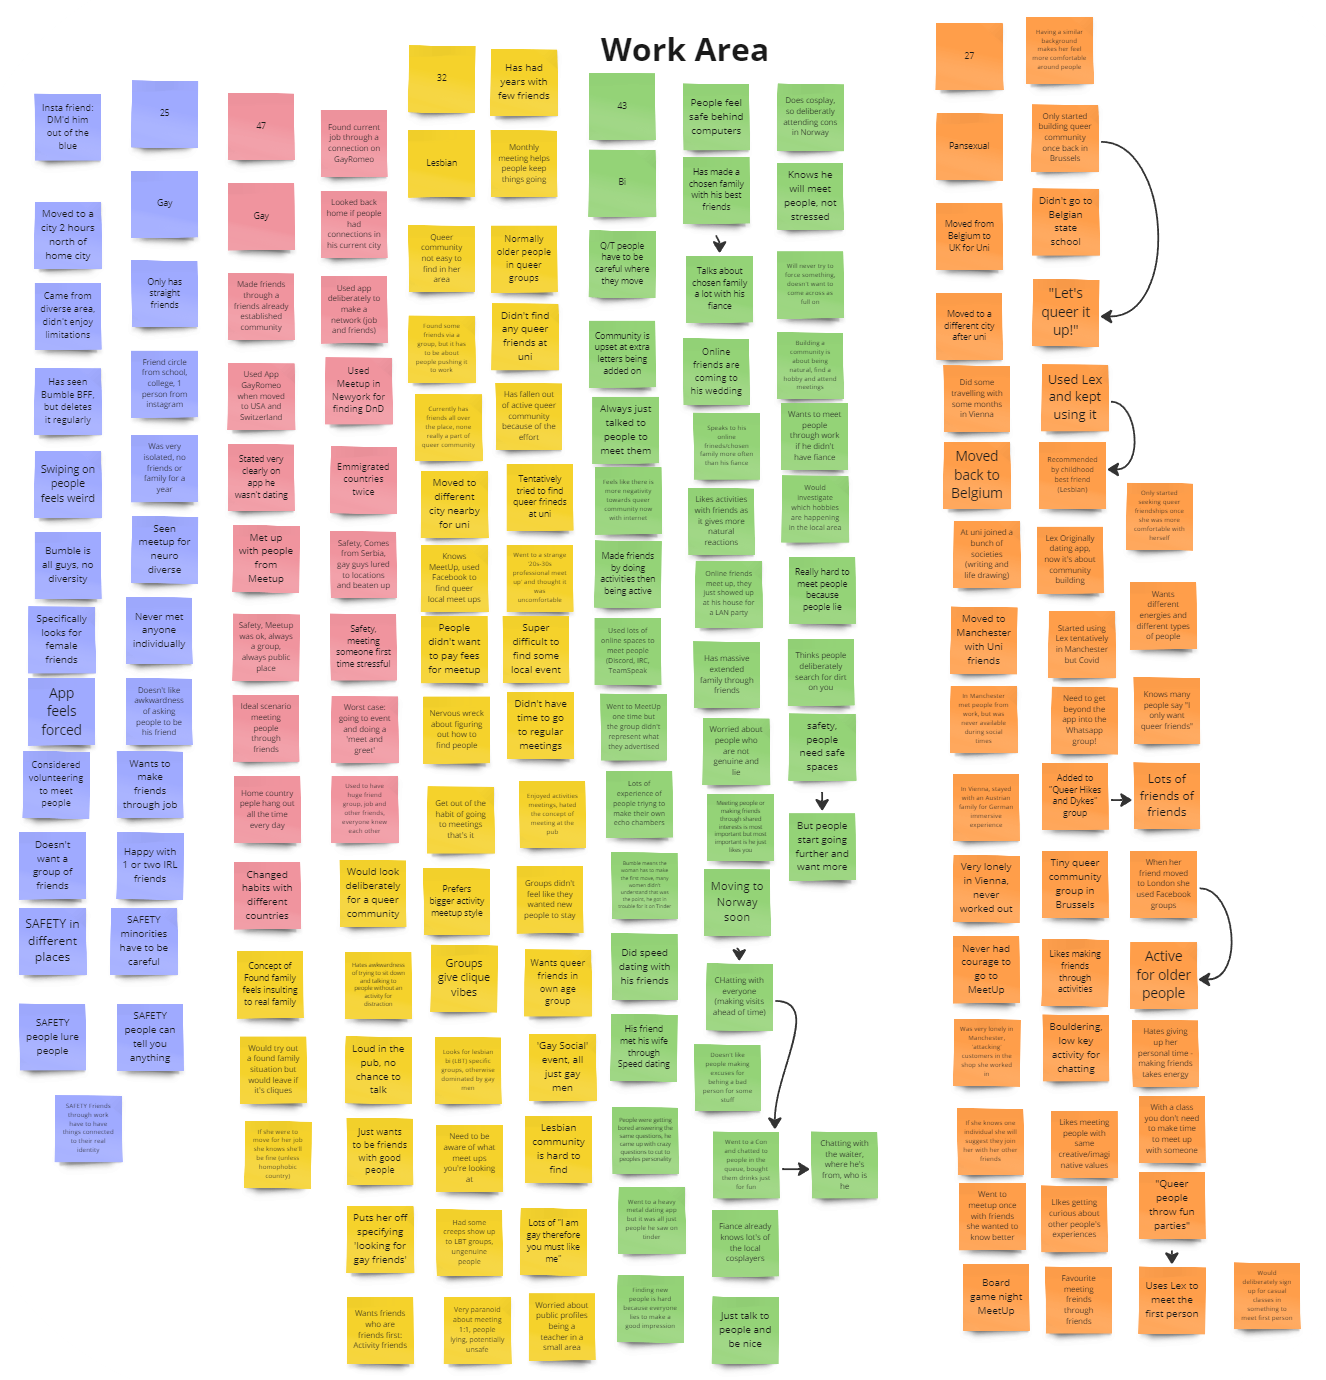
Initial insights organised by user
I was lucky enough to interview five people about their opinions on the challenges faced by queer people in new cities. Despite being very early in the project, conducting early user research is essential to ensure the resulting product represents your users (Kuniavsky 2003). Based on my updated brief, I created an initial problem statement and hypothesis to inform a discussion guide.
Problem Statement
“I need a way to easily and safely connect with like-minded people in my new city because it can be stressful when the only options are big groups.”
Hypothesis
“I believe that by creating intentional meet up solutions based around individuals and their values, newcomers can build strong communities.”
Guide in hand, I interviewed two people in person and three online. I wasn’t nervous about the process, but I was worried about asking questions that were too personal, as I didn’t want to make anyone uncomfortable. However, I think I did a good job of formulating my questions in a sensitive and accessible way. Next time, though, I will take more time to develop different methods of asking the same question to give me more flexibility.

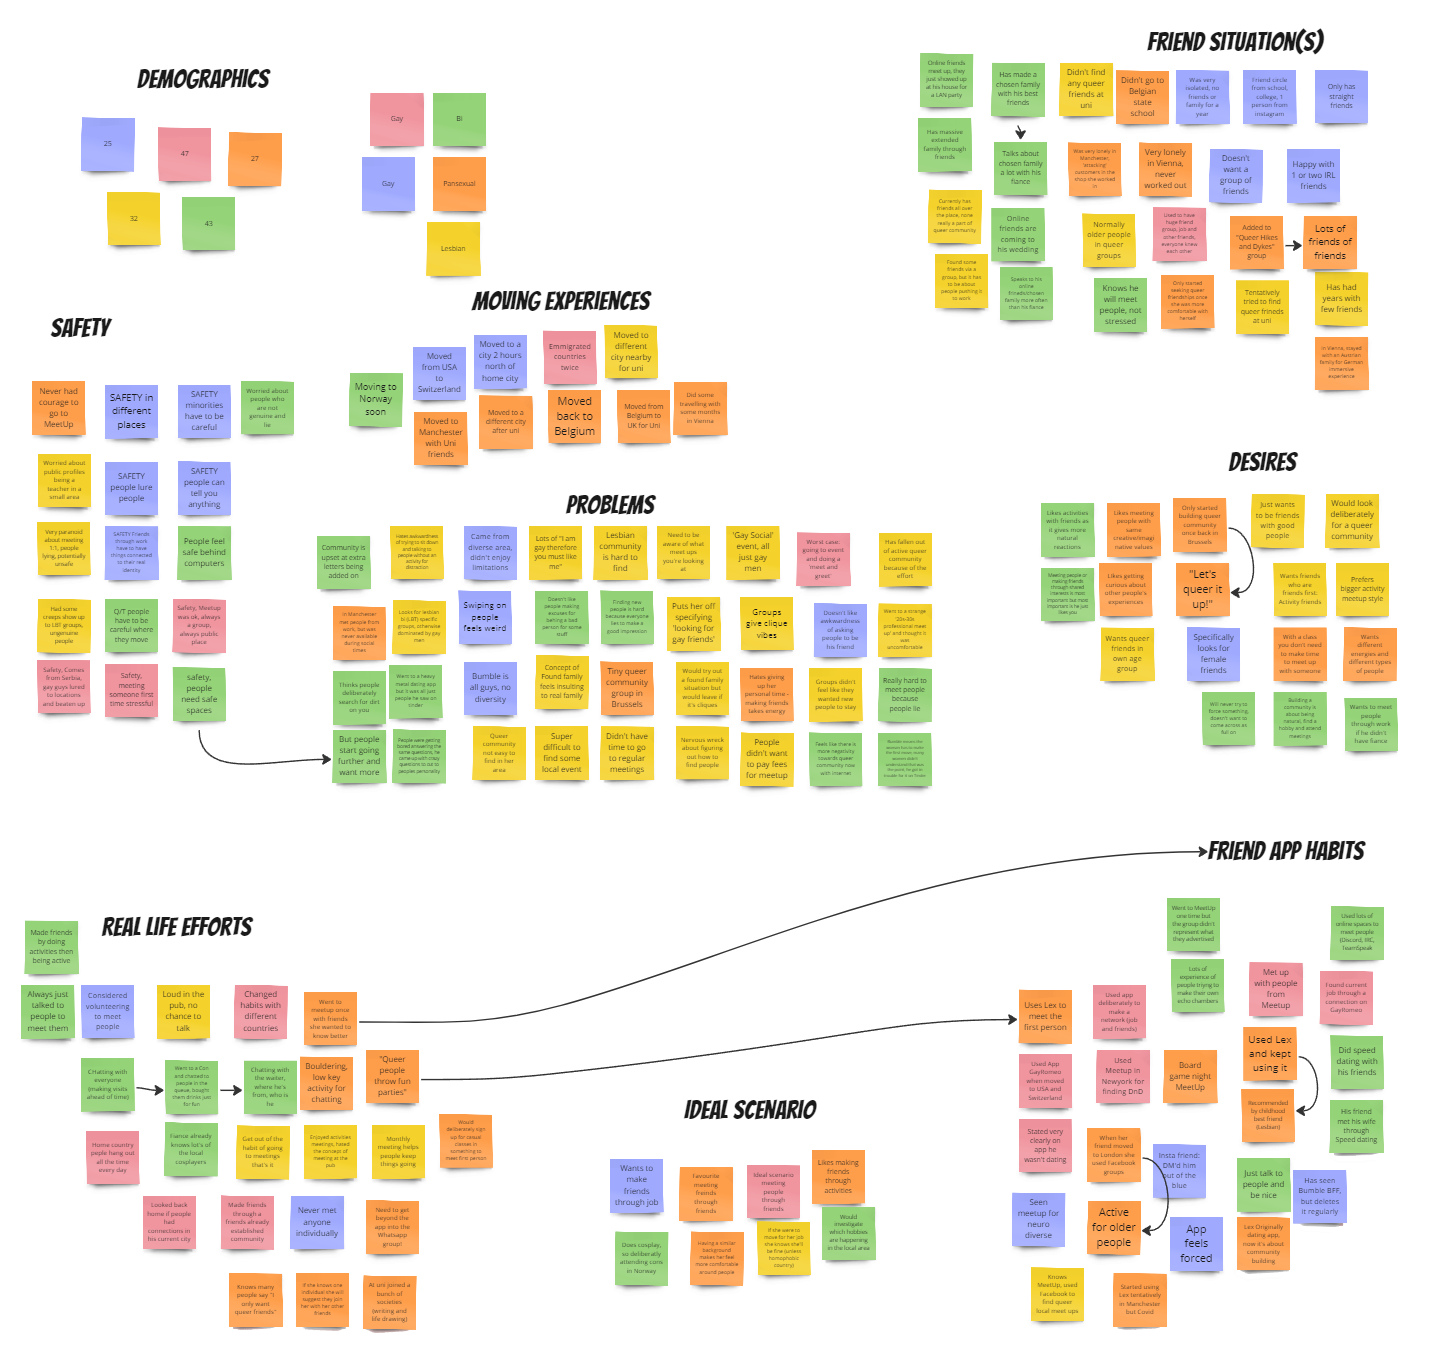
My initial affinity map was too shallow
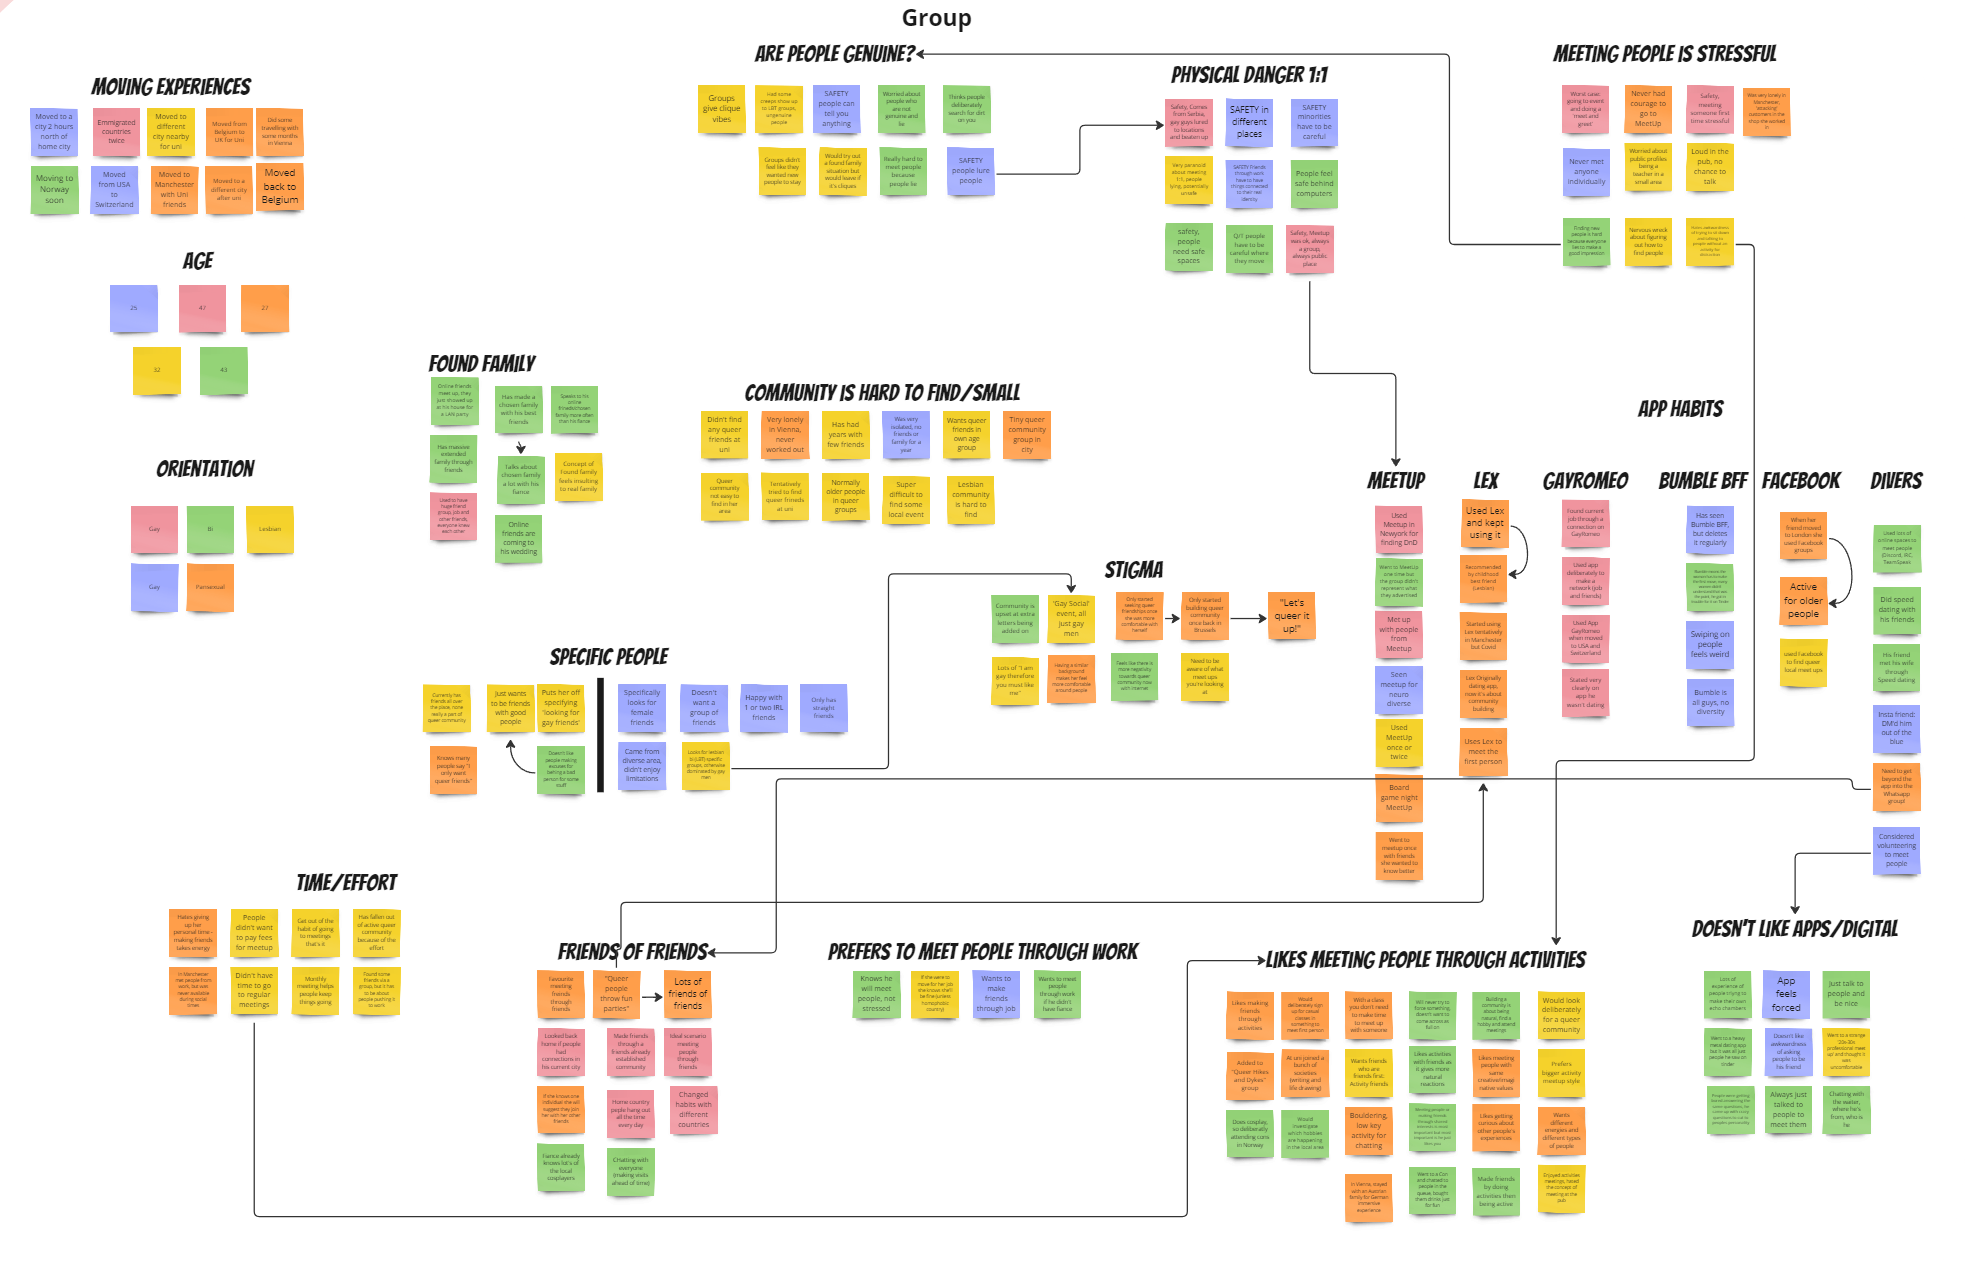
Colour coordinated by the participant, I began grouping my insights and general notes in the Affinity Map template in Miro. I decided on a digital tool instead of post-its as I didn’t need to collaborate with a team on this project. Digitally writing out insights was also more efficient in the time frame. When I looked back at the map, I realised I had grouped the insights by basic topic, exactly what the literature says not to do (Braun and Clarke 2006; Rosala and Pernice 2023). Taking a minute to adjust and think more deliberately about the situation, I broke them down into the essence of the insights, and my affinity map started to shape up much better. For example, I split the ‘Problems’ group into six distinct categories, including: ‘physical danger’, ‘community is hard to find’ and ‘meeting people is stressful’.

My second affinity map studied the insights more closely, organising them around essence rather than theme
Adjusting the insight groupings also clarified the products my users had already tried, which will inform my market research direction.
As the second map was much clearer, I saw that my initial assumptions were wrong. I assumed the main problem of meeting new people was that events are often big groups, making them stressful. But the biggest problem my users identified was safety and knowing if people were genuine rather than trolls. So, based on that and my users’ preferred ways to meet people, I have developed the following two problem statements:
Queer people need a safe way to meet locals so they can make friends with similar life experiences.
New arrivals need a low-effort method to find in-person hobbies in their new area so they can start building communities.
Interviews were a really interesting experience compared to the last module (research), where I conducted a survey. Seeing in real-time how people reacted/answered the same questions was eye-opening, especially as this allowed me to adapt my questions with each interview (wording, order, inflexion, etc.), leading to smoother interviews towards the end. Thinking again about my questions, I see the first few were too specific and I should have ordered them differently to give participants a slower introduction to questioning (Rosala and Pernice 2023). While I was able to improve this to make them more open-ended for later interviews, I still needed to work on keeping follow-up questions open. However, now I know this area requires practice; next time, I can prepare several follow-up questions as part of the discussion guide based on anticipated answers (Rosala and Pernice, 2023).
I am very glad I asked to record every interview. Between interviews, I had a different meeting, which I didn’t record; taking notes simultaneously while driving the conversation and typing quietly proved very tricky! Recording helped the interviews go more smoothly as I could concentrate on the content. Listening back to the recordings also meant I was more familiar with the data and got more valuable insights, as advised by Braun and Clarke (2006).
The opportunity to conduct interviews was great; I found it a worthwhile experience. It clarified the importance of making a good discussion guide and being well-prepared. Next time I conduct interviews, I will prepare a flexible follow-up question framework. My questions could have been better formulated if I had decided on a specific goal for the questions first. Additionally, clearly stating my assumptions from the outset would have helped me prepare better questions, as it would have better illuminated my blind spots. I will definitely take what I have learned here into the next round of testing!
References
BRAUN, Virginia and Victoria CLARKE. 2006. ‘Using Thematic Analysis in Psychology’. Qualitative Research in Psychology 3(2), 77–101.
KUNIAVSKY, Mike. 2003. Observing the User Experience: A Practitioner’s Guide to User Research. San Francisco: Elsevier. Available at: https://books.google.ch/books?id=1tE4Skp9pI8C&printsec=frontcover#v=onepage&q&f=false [accessed 31 Jan 2024].
ROSALA, Maria and Kara PERNICE. 2023. ‘User Interviews 101’. Nielsen Norman Group [online]. Available at: https://www.nngroup.com/articles/user-interviews/ [accessed 31 Jan 2024].
German vocabulary of the week
Experience – Erlebnis
